
- Startseite >
- Flüsse >
- Wasserstand >
- Inn >
- Staudach >
- Jahresgrafik

Jahresgrafik Staudach / Tiroler Achen
Wasserstand vom 21.08.2019 bis zum 20.08.2020
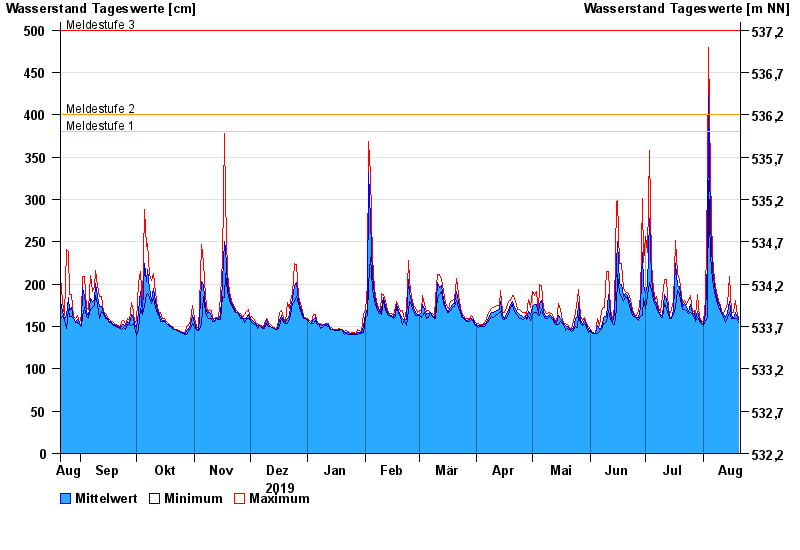
- Meldestufe 1 380 cm
- Meldestufe 2 400 cm
- Meldestufe 3 500 cm
- Meldestufe 4 550 cm
- Hochwassergefahrenfläche HQhäufig 510 cm
- Hochwassergefahrenfläche HQ100 650 cm
| Datum | Mittelwert [cm] | Maximum [cm] | Minimum [cm] |
|---|---|---|---|
| 20.08.2020 | 158 | 161 | 155 |
| 19.08.2020 | 163 | 169 | 159 |
| 18.08.2020 | 166 | 181 | 159 |
| 17.08.2020 | 160 | 166 | 159 |
| 16.08.2020 | 163 | 167 | 159 |
| 15.08.2020 | 179 | 209 | 167 |
| 14.08.2020 | 166 | 177 | 161 |
© Bayerisches Landesamt für Umwelt 2024