
- Startseite >
- Flüsse >
- Wasserstand >
- Inn >
- Staudach >
- Jahresgrafik

Jahresgrafik Staudach / Tiroler Achen
Wasserstand vom 20.11.2019 bis zum 19.11.2020
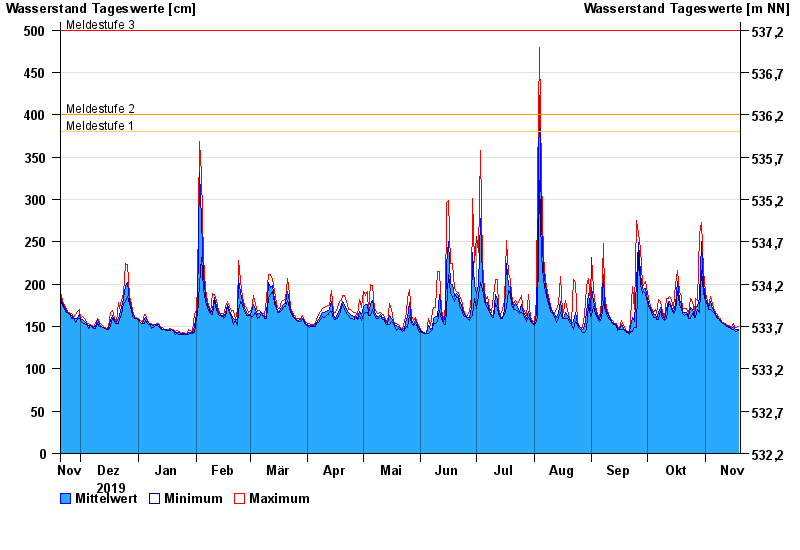
- Meldestufe 1 380 cm
- Meldestufe 2 400 cm
- Meldestufe 3 500 cm
- Meldestufe 4 550 cm
- Hochwassergefahrenfläche HQhäufig 510 cm
- Hochwassergefahrenfläche HQ100 650 cm
| Datum | Mittelwert [cm] | Maximum [cm] | Minimum [cm] |
|---|---|---|---|
| 19.11.2020 | 146 | 150 | 145 |
| 18.11.2020 | 146 | 149 | 144 |
| 17.11.2020 | 148 | 150 | 145 |
| 16.11.2020 | 150 | 154 | 147 |
| 15.11.2020 | 148 | 149 | 147 |
| 14.11.2020 | 150 | 151 | 149 |
| 13.11.2020 | 151 | 151 | 150 |
© Bayerisches Landesamt für Umwelt 2024