
- Startseite >
- Flüsse >
- Wasserstand >
- Inn >
- Staudach >
- Jahresgrafik

Jahresgrafik Staudach / Tiroler Achen
Wasserstand vom 04.08.2020 bis zum 03.08.2021
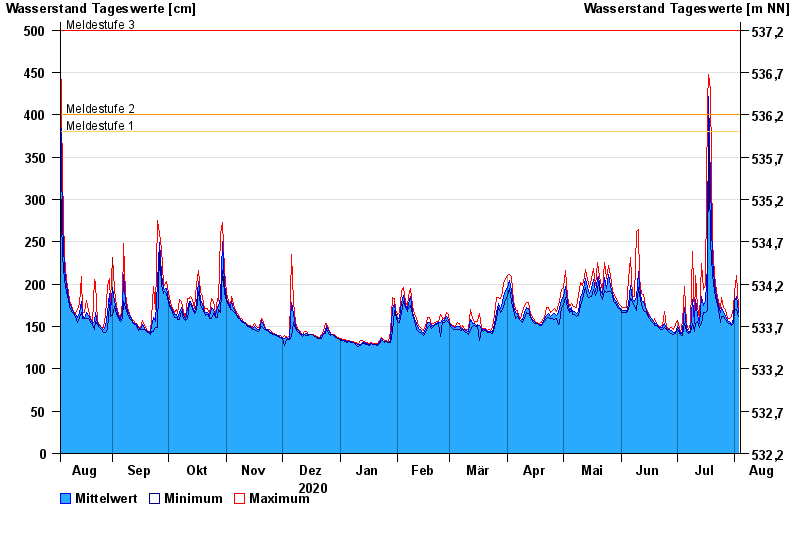
- Meldestufe 1 380 cm
- Meldestufe 2 400 cm
- Meldestufe 3 500 cm
- Meldestufe 4 550 cm
- Hochwassergefahrenfläche HQhäufig 510 cm
- Hochwassergefahrenfläche HQ100 650 cm
| Datum | Mittelwert [cm] | Maximum [cm] | Minimum [cm] |
|---|---|---|---|
| 03.08.2021 | 166 | 173 | 162 |
| 02.08.2021 | 186 | 210 | 170 |
| 01.08.2021 | 179 | 190 | 171 |
| 31.07.2021 | 160 | 172 | 154 |
| 30.07.2021 | 152 | 162 | 151 |
| 29.07.2021 | 156 | 159 | 153 |
| 28.07.2021 | 157 | 159 | 155 |
© Bayerisches Landesamt für Umwelt 2024