
- Startseite >
- Flüsse >
- Wasserstand >
- Inn >
- Postmünster >
- Jahresgrafik

Jahresgrafik Postmünster / Gambach
Wasserstand vom 01.01.2024 bis zum 31.12.2024
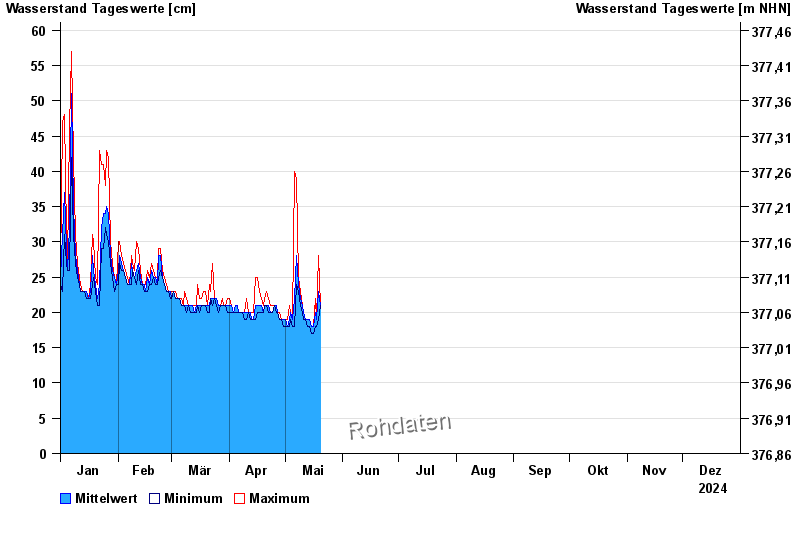
- Hochwassergefahrenfläche HQ100 150 cm
| Datum | Mittelwert [cm] | Maximum [cm] | Minimum [cm] |
|---|---|---|---|
| 07.06.2024 | 27 | 32 | 24 |
| 06.06.2024 | 25 | 32 | 23 |
| 05.06.2024 | 25 | 26 | 24 |
| 04.06.2024 | 30 | 34 | 26 |
| 03.06.2024 | 34 | 49 | 28 |
| 02.06.2024 | 33 | 39 | 29 |
| 01.06.2024 | 43 | 56 | 32 |
© Bayerisches Landesamt für Umwelt 2024