
- Startseite >
- Flüsse >
- Wasserstand >
- Inn >
- Panzing >
- Jahresgrafik

Jahresgrafik Panzing / Bina
Wasserstand vom 27.10.2021 bis zum 26.10.2022
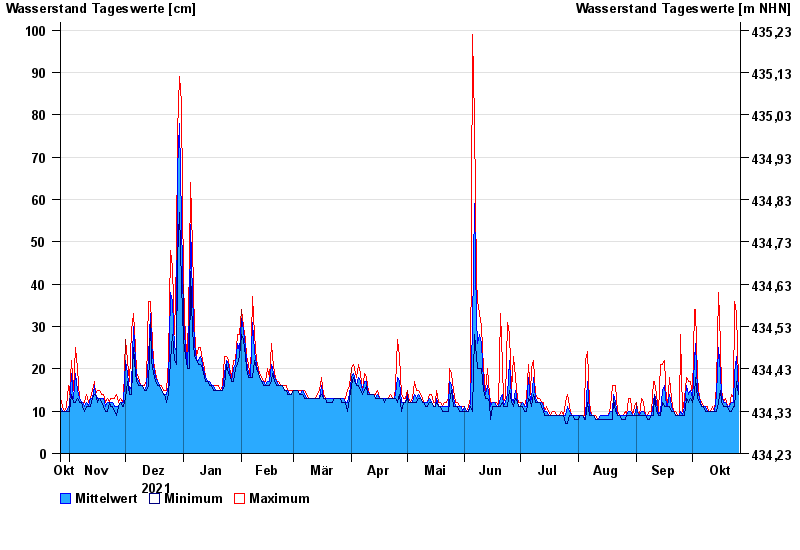
- Hochwassergefahrenfläche HQ100 230 cm
| Datum | Mittelwert [cm] | Maximum [cm] | Minimum [cm] |
|---|---|---|---|
| 26.10.2022 | 15 | 17 | 14 |
| 25.10.2022 | 23 | 33 | 17 |
| 24.10.2022 | 19 | 36 | 11 |
| 23.10.2022 | 12 | 13 | 11 |
| 22.10.2022 | 12 | 14 | 10 |
| 21.10.2022 | 11 | 11 | 10 |
| 20.10.2022 | 11 | 11 | 11 |
© Bayerisches Landesamt für Umwelt 2024