
- Startseite >
- Flüsse >
- Wasserstand >
- Inn >
- Mühldorf >
- Jahresgrafik

Jahresgrafik Mühldorf / Inn
Wasserstand vom 09.12.2019 bis zum 08.12.2020
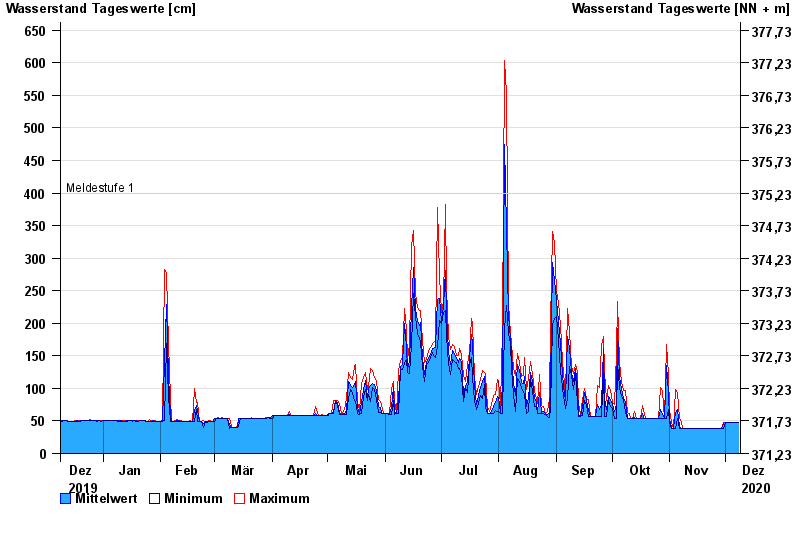
- Meldestufe 1 400 cm
- Hochwassergefahrenfläche HQ100 800 cm
| Datum | Mittelwert [cm] | Maximum [cm] | Minimum [cm] |
|---|---|---|---|
| 08.12.2020 | 48 | 48 | 48 |
| 07.12.2020 | 48 | 48 | 48 |
| 06.12.2020 | 48 | 48 | 48 |
| 05.12.2020 | 48 | 48 | 48 |
| 04.12.2020 | 48 | 48 | 48 |
| 03.12.2020 | 48 | 48 | 48 |
| 02.12.2020 | 48 | 48 | 48 |
© Bayerisches Landesamt für Umwelt 2024