
- Startseite >
- Flüsse >
- Wasserstand >
- Inn >
- Mühldorf >
- Jahresgrafik

Jahresgrafik Mühldorf / Inn
Wasserstand vom 28.01.2022 bis zum 27.01.2023
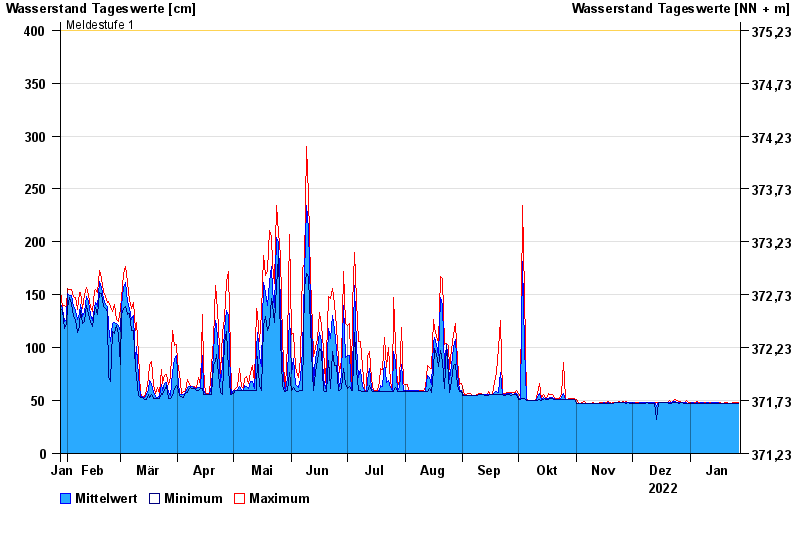
- Meldestufe 1 400 cm
- Hochwassergefahrenfläche HQ100 800 cm
| Datum | Mittelwert [cm] | Maximum [cm] | Minimum [cm] |
|---|---|---|---|
| 27.01.2023 | 47 | 48 | 47 |
| 26.01.2023 | 47 | 48 | 47 |
| 25.01.2023 | 47 | 48 | 47 |
| 24.01.2023 | 47 | 48 | 47 |
| 23.01.2023 | 47 | 47 | 47 |
| 22.01.2023 | 47 | 47 | 47 |
| 21.01.2023 | 47 | 48 | 47 |
© Bayerisches Landesamt für Umwelt 2024