
- Startseite >
- Flüsse >
- Wasserstand >
- Inn >
- Mühldorf >
- Jahresgrafik

Jahresgrafik Mühldorf / Inn
Wasserstand vom 16.11.2018 bis zum 15.11.2019
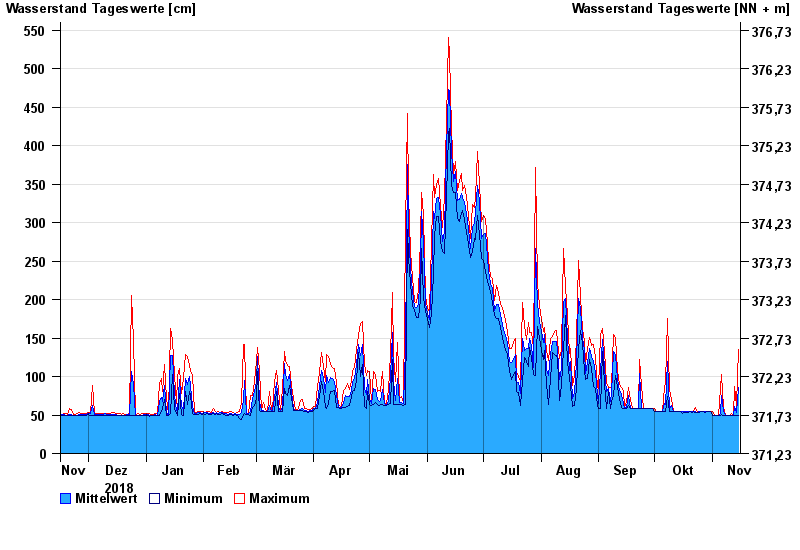
- 800 cm: Mühldorf: Innstrasse, beginnende Überflutung der Unterführung unter der B 12
| Datum | Mittelwert [cm] | Maximum [cm] | Minimum [cm] |
|---|---|---|---|
| 15.11.2019 | 86 | 135 | 49 |
| 14.11.2019 | 53 | 62 | 49 |
| 13.11.2019 | 61 | 87 | 50 |
| 12.11.2019 | 50 | 50 | 49 |
| 11.11.2019 | 50 | 52 | 49 |
| 10.11.2019 | 49 | 50 | 49 |
| 09.11.2019 | 50 | 50 | 50 |
© Bayerisches Landesamt für Umwelt 2024