
- Startseite >
- Flüsse >
- Wasserstand >
- Inn >
- Mühlau >
- Jahresgrafik

Jahresgrafik Mühlau / Mühlbach
Wasserstand vom 03.12.2023 bis zum 02.12.2024
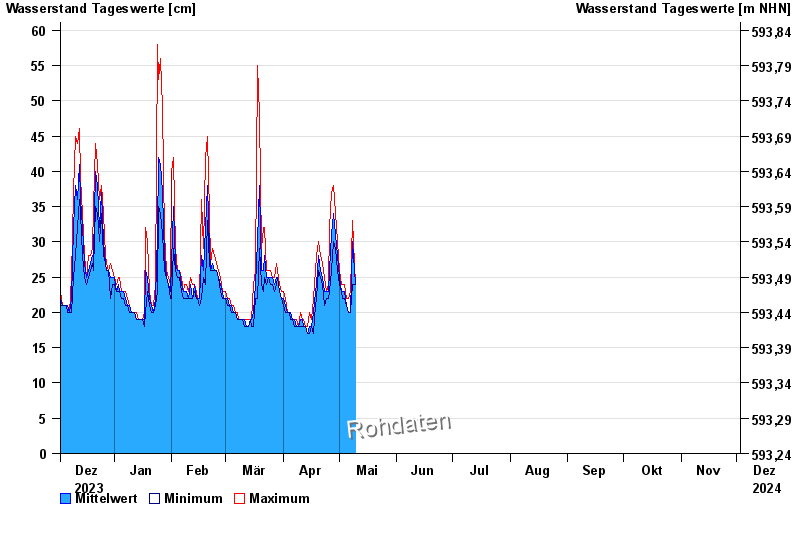
- Hochwassergefahrenfläche HQhäufig 100 cm
| Datum | Mittelwert [cm] | Maximum [cm] | Minimum [cm] |
|---|---|---|---|
| 27.04.2024 | 30 | 37 | 26 |
| 26.04.2024 | 26 | 32 | 23 |
| 25.04.2024 | 23 | 24 | 22 |
| 24.04.2024 | 23 | 23 | 22 |
| 23.04.2024 | 23 | 25 | 21 |
| 22.04.2024 | 25 | 27 | 24 |
| 21.04.2024 | 26 | 28 | 25 |
© Bayerisches Landesamt für Umwelt 2024