
- Startseite >
- Flüsse >
- Wasserstand >
- Inn >
- Hochberg >
- Jahresgrafik

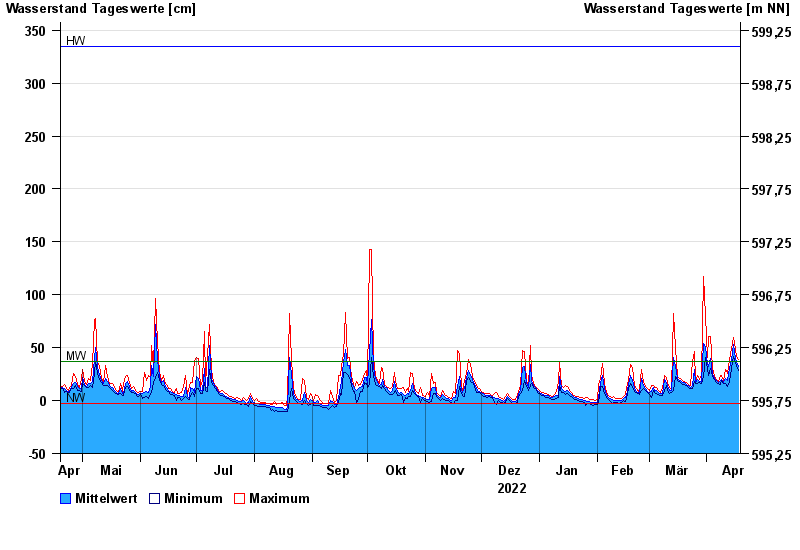
Jahresgrafik Hochberg / Traun
Wasserstand vom 19.04.2022 bis zum 18.04.2023
| Datum | Mittelwert [cm] | Maximum [cm] | Minimum [cm] |
|---|---|---|---|
| 18.04.2023 | 32 | 39 | 28 |
| 17.04.2023 | 36 | 42 | 33 |
| 16.04.2023 | 45 | 55 | 39 |
| 15.04.2023 | 53 | 60 | 42 |
| 14.04.2023 | 38 | 49 | 30 |
| 13.04.2023 | 30 | 39 | 18 |
| 12.04.2023 | 19 | 26 | 13 |
© Bayerisches Landesamt für Umwelt 2024