
- Startseite >
- Flüsse >
- Wasserstand >
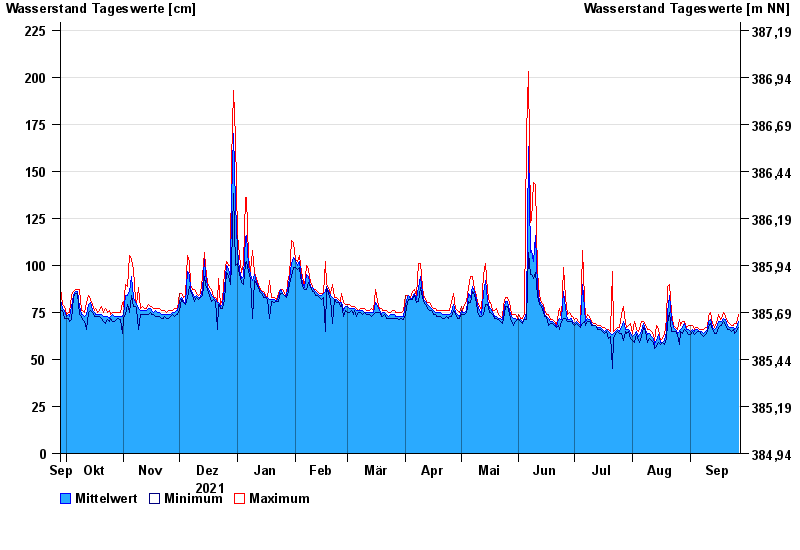
- Inn >
- Engfurt >
- Jahresgrafik

Jahresgrafik Engfurt / Isen
Wasserstand vom 28.09.2021 bis zum 27.09.2022
Hinweis
zeitweise Beeinflussung durch Kraftwerksbetrieb möglich
- 02.02.1985 Wasserstand: 386 cm
- 31.01.1982 Wasserstand: 365 cm
- 03.08.1991 Wasserstand: 358 cm
- 02.06.2013 Wasserstand: 352 cm
- 02.03.1987 Wasserstand: 346 cm
| Datum | Mittelwert [cm] | Maximum [cm] | Minimum [cm] |
|---|---|---|---|
| 27.09.2022 | 70 | 74 | 67 |
| 26.09.2022 | 67 | 69 | 65 |
| 25.09.2022 | 66 | 69 | 64 |
| 24.09.2022 | 67 | 68 | 66 |
| 23.09.2022 | 67 | 68 | 65 |
| 22.09.2022 | 67 | 69 | 66 |
| 21.09.2022 | 68 | 70 | 66 |
© Bayerisches Landesamt für Umwelt 2024