
- Startseite >
- Flüsse >
- Wasserstand >
- Inn >
- Brodhausen >
- Jahresgrafik

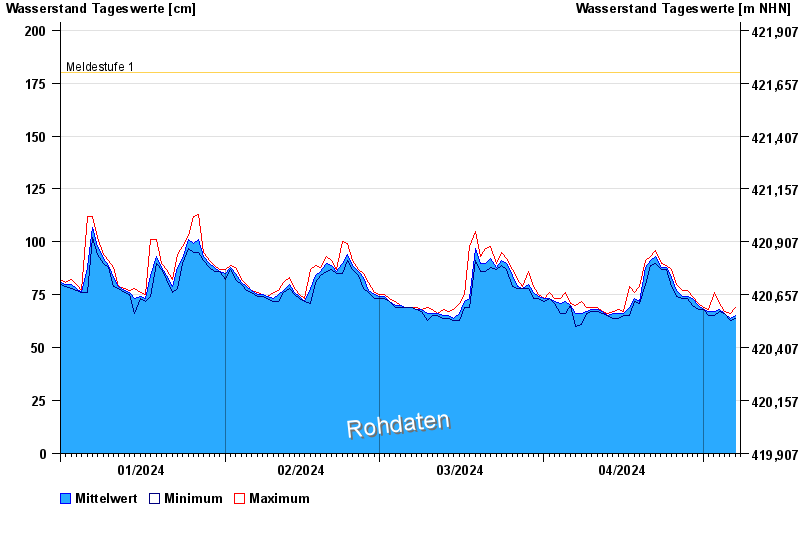
Jahresgrafik Brodhausen / Sur
Wasserstand vom 01.01.2024 bis zum 07.05.2024
Hinweis
Zeitweise Beeinflussung der Daten durch Surspeichersteuerung möglich.
- Meldestufe 1 180 cm
| Datum | Mittelwert [cm] | Maximum [cm] | Minimum [cm] |
|---|---|---|---|
| 07.05.2024 | 64 | 65 | 64 |
| 06.05.2024 | 64 | 66 | 63 |
| 05.05.2024 | 66 | 67 | 66 |
| 04.05.2024 | 68 | 71 | 67 |
| 03.05.2024 | 67 | 76 | 65 |
| 02.05.2024 | 67 | 68 | 65 |
| 01.05.2024 | 68 | 69 | 68 |
© Bayerisches Landesamt für Umwelt 2024