
- Startseite >
- Flüsse >
- Wasserstand >
- Inn >
- Berchtesgaden-Klärwerk >
- Jahresgrafik

Jahresgrafik Berchtesgaden-Klärwerk / Berchtesgadener Ache
Wasserstand vom 11.08.2021 bis zum 10.08.2022
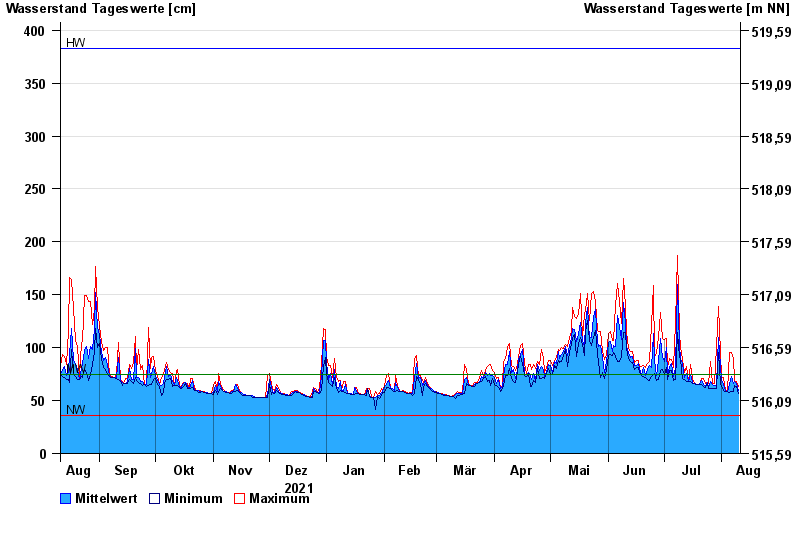
| Datum | Mittelwert [cm] | Maximum [cm] | Minimum [cm] |
|---|---|---|---|
| 10.08.2022 | 60 | 63 | 57 |
| 09.08.2022 | 66 | 68 | 63 |
| 08.08.2022 | 68 | 69 | 64 |
| 07.08.2022 | 66 | 90 | 59 |
| 06.08.2022 | 73 | 95 | 59 |
| 05.08.2022 | 65 | 95 | 58 |
| 04.08.2022 | 59 | 60 | 59 |
© Bayerisches Landesamt für Umwelt 2024