
- Startseite >
- Flüsse >
- Wasserstand >
- Inn >
- Berchtesgaden-Klärwerk >
- Jahresgrafik

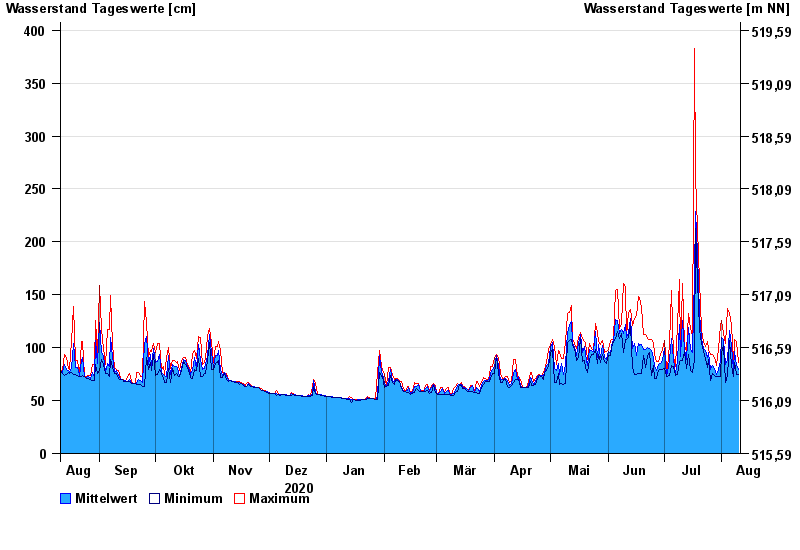
Jahresgrafik Berchtesgaden-Klärwerk / Berchtesgadener Ache
Wasserstand vom 11.08.2020 bis zum 10.08.2021
| Datum | Mittelwert [cm] | Maximum [cm] | Minimum [cm] |
|---|---|---|---|
| 10.08.2021 | 79 | 86 | 75 |
| 09.08.2021 | 83 | 106 | 75 |
| 08.08.2021 | 96 | 108 | 86 |
| 07.08.2021 | 79 | 86 | 73 |
| 06.08.2021 | 101 | 122 | 83 |
| 05.08.2021 | 116 | 132 | 107 |
| 04.08.2021 | 89 | 137 | 74 |
© Bayerisches Landesamt für Umwelt 2024