
- Startseite >
- Flüsse >
- Wasserstand >
- Inn >
- Bad Kreuth >
- Jahresgrafik

Jahresgrafik Bad Kreuth / Sagenbach
Wasserstand vom 18.01.2024 bis zum 17.01.2025
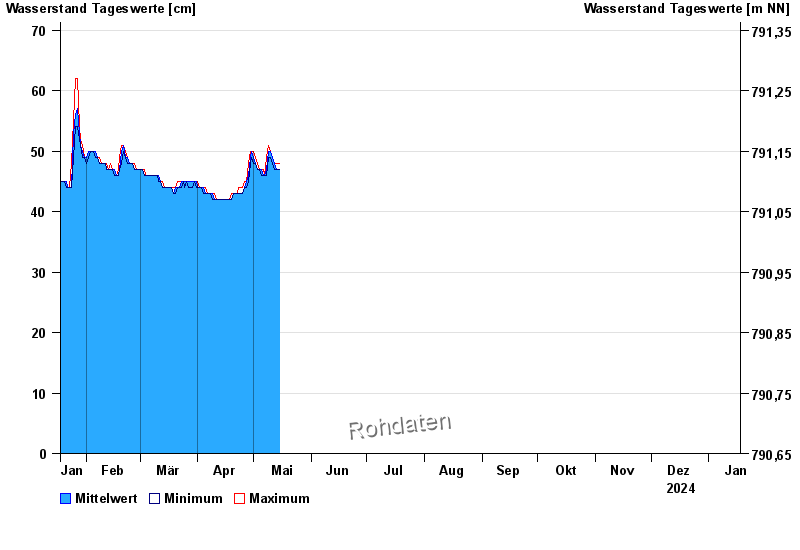
- Hochwassergefahrenfläche HQ100 140 cm
| Datum | Mittelwert [cm] | Maximum [cm] | Minimum [cm] |
|---|---|---|---|
| 19.06.2024 | 49 | 50 | 48 |
| 18.06.2024 | 50 | 51 | 49 |
| 17.06.2024 | 51 | 52 | 50 |
| 16.06.2024 | 52 | 52 | 51 |
| 15.06.2024 | 52 | 52 | 51 |
| 14.06.2024 | 52 | 53 | 52 |
| 13.06.2024 | 53 | 55 | 53 |
© Bayerisches Landesamt für Umwelt 2024