
- Startseite >
- Flüsse >
- Wasserstand >
- Inn >
- Bad Aibling >
- Jahresgrafik

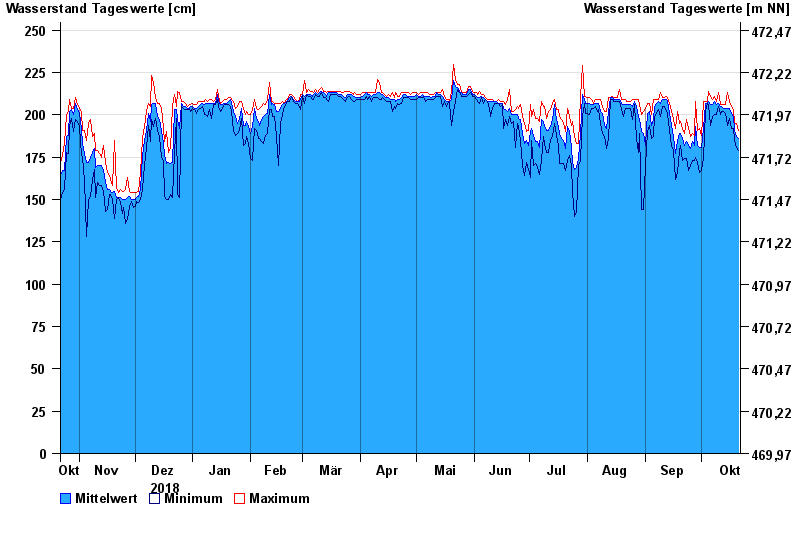
Jahresgrafik Bad Aibling / Triftbach linker Mühlkanal
Wasserstand vom 22.10.2018 bis zum 21.10.2019
| Datum | Mittelwert [cm] | Maximum [cm] | Minimum [cm] |
|---|---|---|---|
| 21.10.2019 | 186 | 191 | 179 |
| 20.10.2019 | 187 | 195 | 181 |
| 19.10.2019 | 191 | 195 | 185 |
| 18.10.2019 | 199 | 203 | 192 |
| 17.10.2019 | 201 | 205 | 192 |
| 16.10.2019 | 204 | 208 | 198 |
| 15.10.2019 | 204 | 213 | 194 |
© Bayerisches Landesamt für Umwelt 2024