
- Startseite >
- Flüsse >
- Wasserstand >
- Inn >
- Bad Aibling >
- Jahresgrafik

Jahresgrafik Bad Aibling / Triftbach linker Mühlkanal
Wasserstand vom 22.10.2021 bis zum 21.10.2022
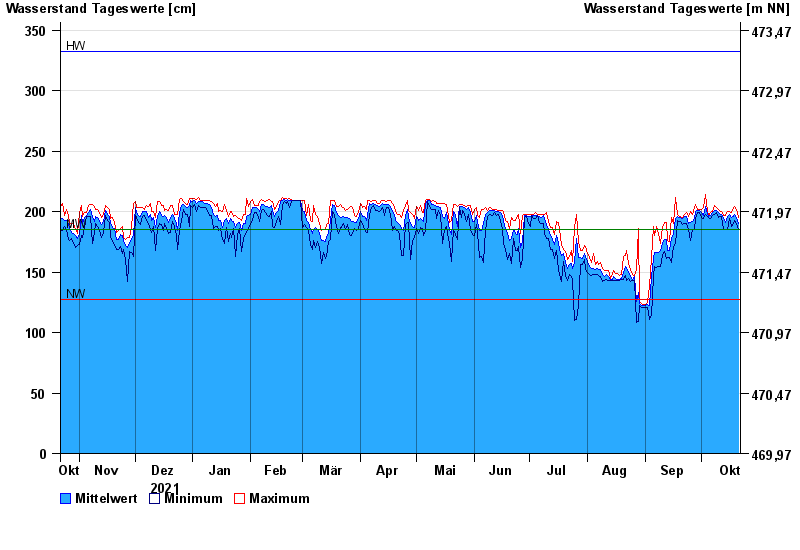
| Datum | Mittelwert [cm] | Maximum [cm] | Minimum [cm] |
|---|---|---|---|
| 21.10.2022 | 190 | 195 | 185 |
| 20.10.2022 | 195 | 202 | 190 |
| 19.10.2022 | 198 | 204 | 193 |
| 18.10.2022 | 196 | 203 | 190 |
| 17.10.2022 | 195 | 199 | 188 |
| 16.10.2022 | 198 | 200 | 194 |
| 15.10.2022 | 196 | 200 | 185 |
© Bayerisches Landesamt für Umwelt 2024