
- Startseite >
- Flüsse >
- Wasserstand >
- Inn >
- Bad Aibling >
- Jahresgrafik

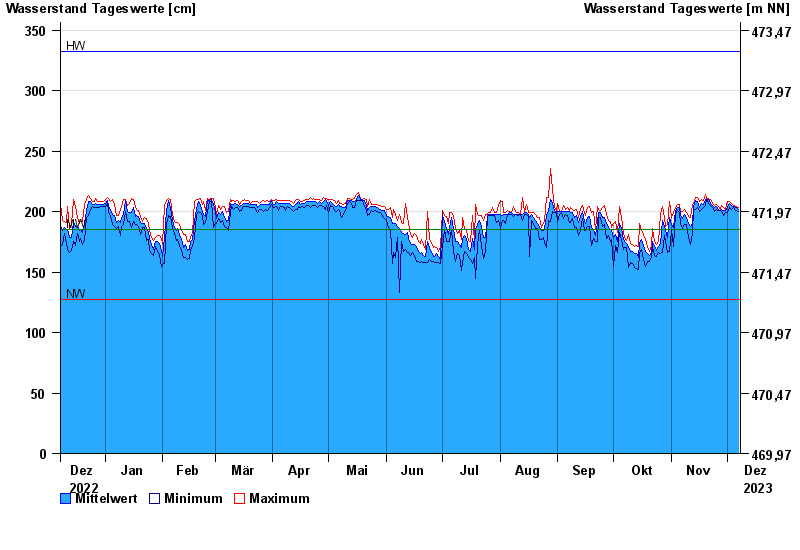
Jahresgrafik Bad Aibling / Triftbach linker Mühlkanal
Wasserstand vom 08.12.2022 bis zum 07.12.2023
| Datum | Mittelwert [cm] | Maximum [cm] | Minimum [cm] |
|---|---|---|---|
| 07.12.2023 | 202 | 203 | 200 |
| 06.12.2023 | 203 | 204 | 201 |
| 05.12.2023 | 204 | 205 | 202 |
| 04.12.2023 | 204 | 205 | 203 |
| 03.12.2023 | 205 | 207 | 202 |
| 02.12.2023 | 207 | 208 | 203 |
| 01.12.2023 | 203 | 208 | 199 |
© Bayerisches Landesamt für Umwelt 2024