
- Startseite >
- Flüsse >
- Wasserstand >
- Iller - Lech - Bodensee >
- Unterthingau >
- Jahresgrafik

Jahresgrafik Unterthingau / Kirnach
Wasserstand vom 21.02.2021 bis zum 20.02.2022
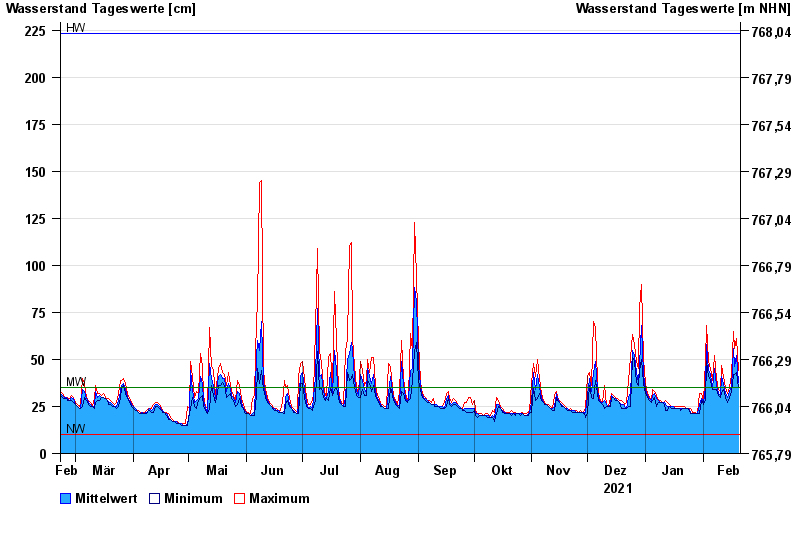
| Datum | Mittelwert [cm] | Maximum [cm] | Minimum [cm] |
|---|---|---|---|
| 20.02.2022 | 38 | 44 | 35 |
| 19.02.2022 | 52 | 61 | 43 |
| 18.02.2022 | 46 | 56 | 42 |
| 17.02.2022 | 56 | 65 | 42 |
| 16.02.2022 | 35 | 42 | 33 |
| 15.02.2022 | 33 | 35 | 30 |
| 14.02.2022 | 30 | 32 | 27 |
© Bayerisches Landesamt für Umwelt 2024