
- Startseite >
- Flüsse >
- Wasserstand >
- Iller - Lech - Bodensee >
- Unterthingau >
- Jahresgrafik

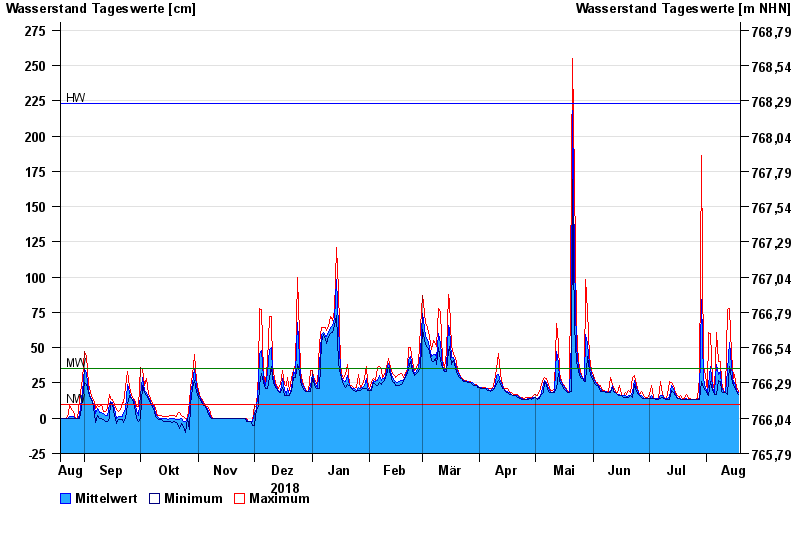
Jahresgrafik Unterthingau / Kirnach
Wasserstand vom 19.08.2018 bis zum 18.08.2019
| Datum | Mittelwert [cm] | Maximum [cm] | Minimum [cm] |
|---|---|---|---|
| 18.08.2019 | 18 | 19 | 17 |
| 17.08.2019 | 20 | 22 | 19 |
| 16.08.2019 | 25 | 31 | 22 |
| 15.08.2019 | 24 | 28 | 23 |
| 14.08.2019 | 37 | 46 | 28 |
| 13.08.2019 | 54 | 78 | 37 |
| 12.08.2019 | 34 | 77 | 17 |
© Bayerisches Landesamt für Umwelt 2024