
- Startseite >
- Flüsse >
- Wasserstand >
- Iller - Lech - Bodensee >
- Unterthingau >
- Jahresgrafik

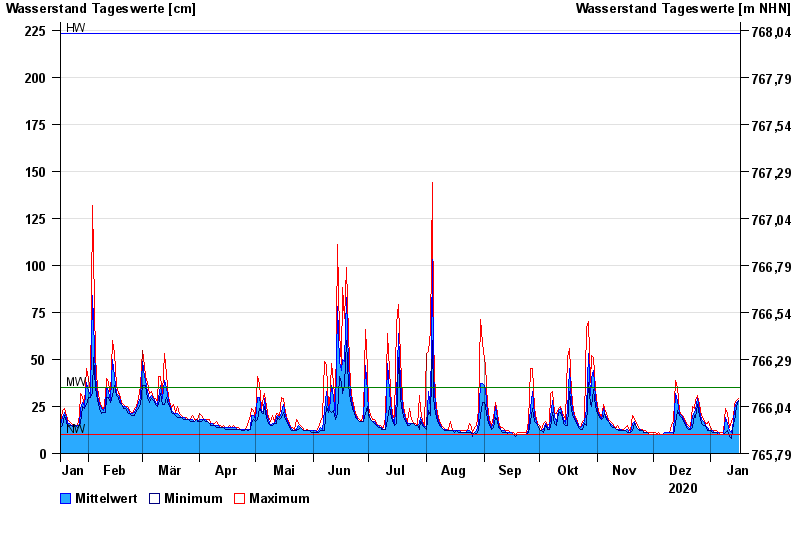
Jahresgrafik Unterthingau / Kirnach
Wasserstand vom 17.01.2020 bis zum 16.01.2021
| Datum | Mittelwert [cm] | Maximum [cm] | Minimum [cm] |
|---|---|---|---|
| 16.01.2021 | 28 | 29 | 28 |
| 15.01.2021 | 27 | 28 | 25 |
| 14.01.2021 | 24 | 26 | 17 |
| 13.01.2021 | 17 | 19 | 16 |
| 12.01.2021 | 11 | 17 | 8 |
| 11.01.2021 | 12 | 14 | 9 |
| 10.01.2021 | 16 | 21 | 12 |
© Bayerisches Landesamt für Umwelt 2024