
- Startseite >
- Flüsse >
- Wasserstand >
- Iller - Lech - Bodensee >
- Unterthingau >
- Jahresgrafik

Jahresgrafik Unterthingau / Kirnach
Wasserstand vom 03.08.2020 bis zum 02.08.2021
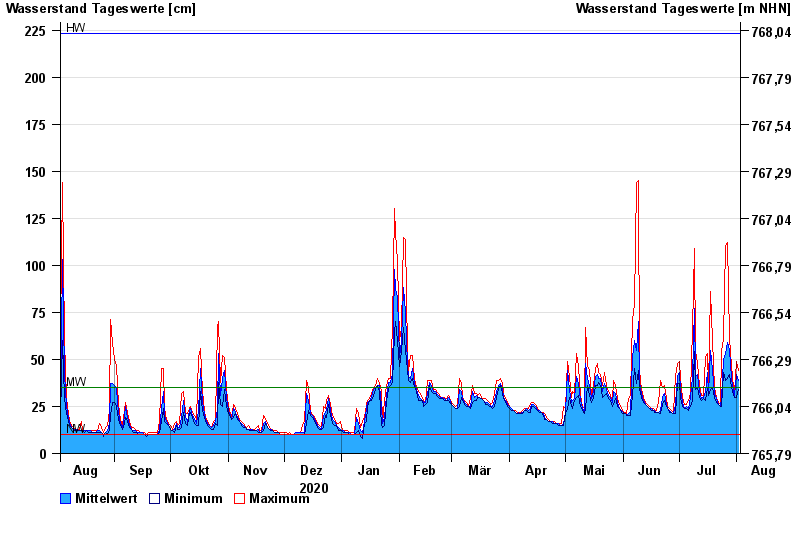
| Datum | Mittelwert [cm] | Maximum [cm] | Minimum [cm] |
|---|---|---|---|
| 02.08.2021 | 39 | 44 | 34 |
| 01.08.2021 | 42 | 49 | 30 |
| 31.07.2021 | 31 | 32 | 30 |
| 30.07.2021 | 33 | 35 | 31 |
| 29.07.2021 | 40 | 47 | 35 |
| 28.07.2021 | 55 | 61 | 42 |
| 27.07.2021 | 59 | 112 | 40 |
© Bayerisches Landesamt für Umwelt 2024