
- Startseite >
- Flüsse >
- Wasserstand >
- Iller - Lech - Bodensee >
- Unterthingau >
- Jahresgrafik

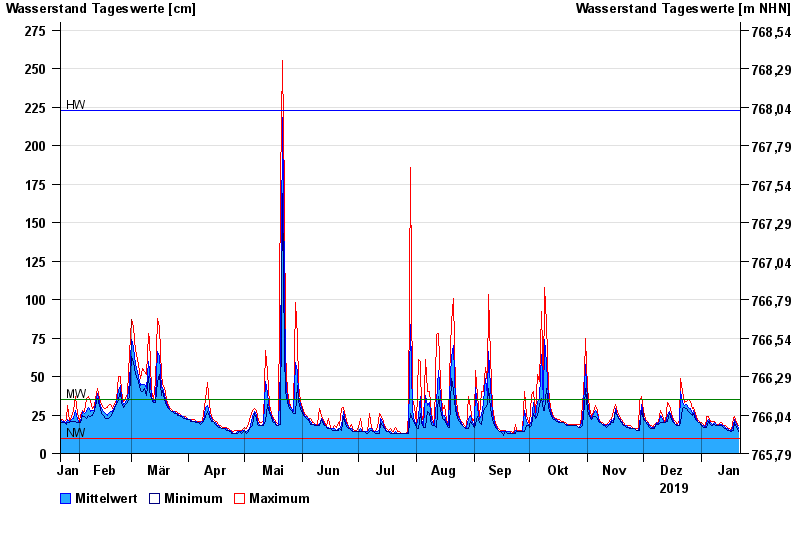
Jahresgrafik Unterthingau / Kirnach
Wasserstand vom 22.01.2019 bis zum 21.01.2020
| Datum | Mittelwert [cm] | Maximum [cm] | Minimum [cm] |
|---|---|---|---|
| 21.01.2020 | 16 | 18 | 14 |
| 20.01.2020 | 19 | 20 | 17 |
| 19.01.2020 | 22 | 24 | 20 |
| 18.01.2020 | 19 | 23 | 15 |
| 17.01.2020 | 15 | 15 | 14 |
| 16.01.2020 | 15 | 16 | 15 |
| 15.01.2020 | 16 | 17 | 15 |
© Bayerisches Landesamt für Umwelt 2024