
- Startseite >
- Flüsse >
- Wasserstand >
- Iller - Lech - Bodensee >
- Unterthingau >
- Jahresgrafik

Jahresgrafik Unterthingau / Kirnach
Wasserstand vom 13.08.2022 bis zum 12.08.2023
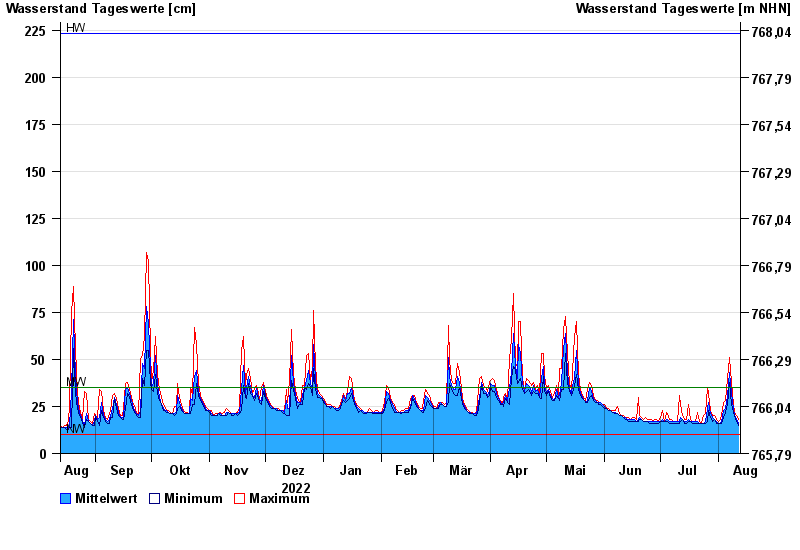
| Datum | Mittelwert [cm] | Maximum [cm] | Minimum [cm] |
|---|---|---|---|
| 12.08.2023 | 16 | 18 | 15 |
| 11.08.2023 | 18 | 20 | 17 |
| 10.08.2023 | 20 | 22 | 20 |
| 09.08.2023 | 24 | 26 | 22 |
| 08.08.2023 | 32 | 38 | 26 |
| 07.08.2023 | 43 | 51 | 38 |
| 06.08.2023 | 31 | 40 | 26 |
© Bayerisches Landesamt für Umwelt 2024