
- Startseite >
- Flüsse >
- Wasserstand >
- Iller - Lech - Bodensee >
- Türkheim >
- Jahresgrafik

Jahresgrafik Türkheim / Wertach
Wasserstand vom 27.05.2021 bis zum 26.05.2022
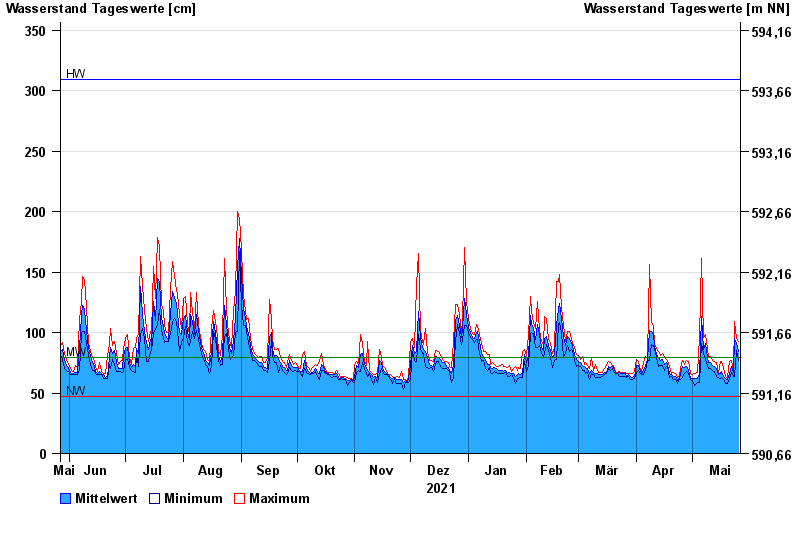
Hinweis
Beeinflussung durch Kraftwerksbetrieb
| Datum | Mittelwert [cm] | Maximum [cm] | Minimum [cm] |
|---|---|---|---|
| 26.05.2022 | 84 | 93 | 77 |
| 25.05.2022 | 91 | 95 | 85 |
| 24.05.2022 | 95 | 109 | 64 |
| 23.05.2022 | 67 | 68 | 64 |
| 22.05.2022 | 72 | 77 | 67 |
| 21.05.2022 | 66 | 76 | 62 |
| 20.05.2022 | 61 | 63 | 58 |
© Bayerisches Landesamt für Umwelt 2024