
- Startseite >
- Flüsse >
- Wasserstand >
- Iller - Lech - Bodensee >
- Türkheim >
- Jahresgrafik

Jahresgrafik Türkheim / Wertach
Wasserstand vom 26.08.2021 bis zum 25.08.2022
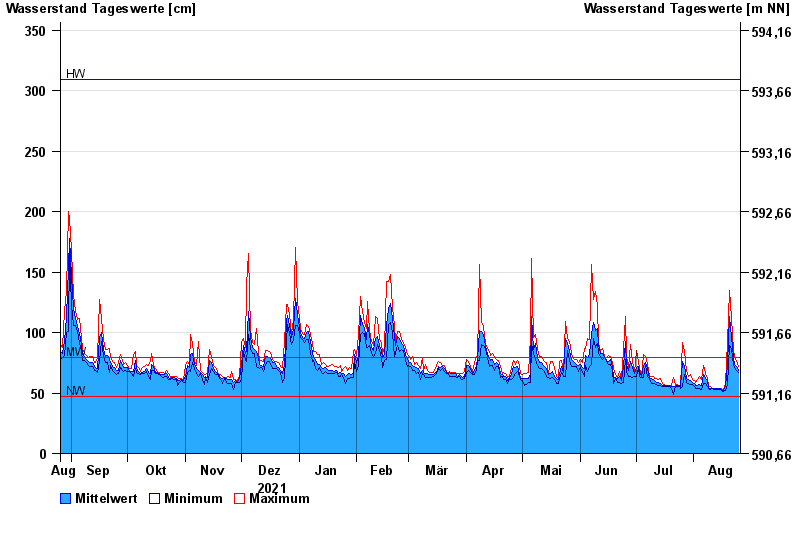
Hinweis
Beeinflussung durch Kraftwerksbetrieb
| Datum | Mittelwert [cm] | Maximum [cm] | Minimum [cm] |
|---|---|---|---|
| 25.08.2022 | 69 | 72 | 67 |
| 24.08.2022 | 72 | 77 | 69 |
| 23.08.2022 | 74 | 79 | 71 |
| 22.08.2022 | 79 | 86 | 73 |
| 21.08.2022 | 96 | 112 | 86 |
| 20.08.2022 | 113 | 135 | 89 |
| 19.08.2022 | 74 | 93 | 57 |
© Bayerisches Landesamt für Umwelt 2024