
- Startseite >
- Flüsse >
- Wasserstand >
- Iller - Lech - Bodensee >
- Türkheim >
- Jahresgrafik

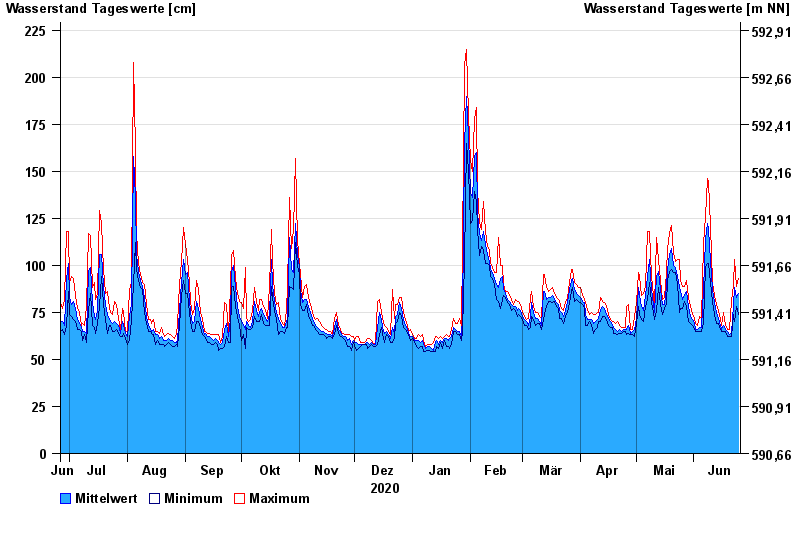
Jahresgrafik Türkheim / Wertach
Wasserstand vom 26.06.2020 bis zum 25.06.2021
Hinweis
Beeinflussung durch Kraftwerksbetrieb
| Datum | Mittelwert [cm] | Maximum [cm] | Minimum [cm] |
|---|---|---|---|
| 25.06.2021 | 85 | 93 | 74 |
| 24.06.2021 | 83 | 89 | 78 |
| 23.06.2021 | 88 | 103 | 70 |
| 22.06.2021 | 79 | 90 | 74 |
| 21.06.2021 | 64 | 81 | 62 |
| 20.06.2021 | 63 | 66 | 62 |
| 19.06.2021 | 65 | 66 | 62 |
© Bayerisches Landesamt für Umwelt 2024