
- Startseite >
- Flüsse >
- Wasserstand >
- Iller - Lech - Bodensee >
- Türkheim >
- Jahresgrafik

Jahresgrafik Türkheim / Wertach
Wasserstand vom 07.05.2023 bis zum 06.05.2024
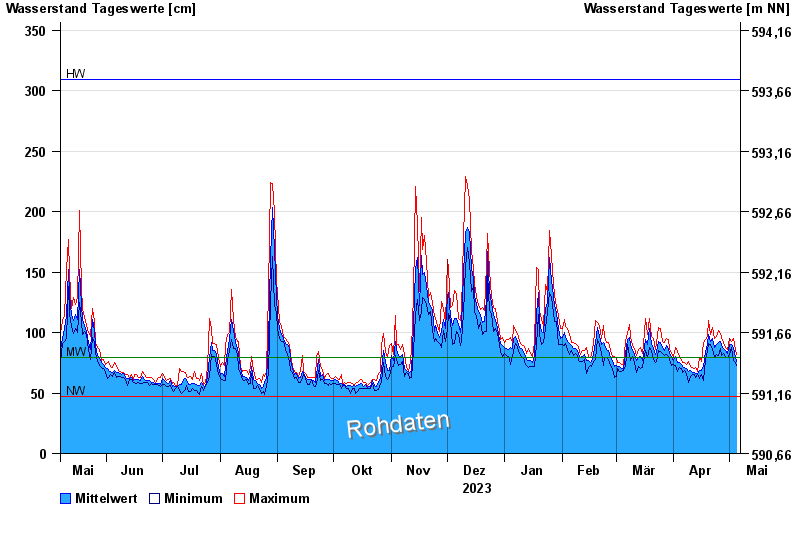
Hinweis
Beeinflussung durch Kraftwerksbetrieb
| Datum | Mittelwert [cm] | Maximum [cm] | Minimum [cm] |
|---|---|---|---|
| 06.05.2024 | 81 | 95 | 68 |
| 05.05.2024 | 77 | 83 | 70 |
| 04.05.2024 | 79 | 85 | 75 |
| 03.05.2024 | 88 | 95 | 77 |
| 02.05.2024 | 90 | 93 | 88 |
| 01.05.2024 | 90 | 95 | 82 |
| 30.04.2024 | 83 | 86 | 79 |
© Bayerisches Landesamt für Umwelt 2024