
- Startseite >
- Flüsse >
- Wasserstand >
- Iller - Lech - Bodensee >
- Spielmannsau >
- Jahresgrafik

Jahresgrafik Spielmannsau / Traufbach
Wasserstand vom 01.01.2022 bis zum 31.12.2022
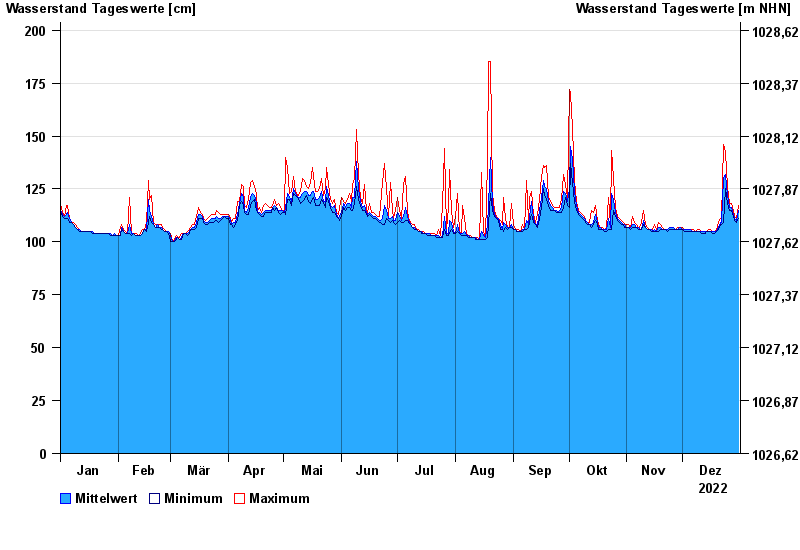 Für diesen Pegel sind keine Meldestufen hinterlegt.
| Datum | Mittelwert [cm] | Maximum [cm] | Minimum [cm] |
|---|---|---|---|
| 31.12.2022 | 115 | 117 | 111 |
| 30.12.2022 | 110 | 111 | 109 |
| 29.12.2022 | 111 | 112 | 110 |
| 28.12.2022 | 113 | 115 | 112 |
| 27.12.2022 | 116 | 118 | 115 |
| 26.12.2022 | 116 | 118 | 115 |
| 25.12.2022 | 122 | 126 | 118 |
 weitere Messwerte weitere Messwerte | |||

© Bayerisches Landesamt für Umwelt 2024