
- Startseite >
- Flüsse >
- Wasserstand >
- Iller - Lech - Bodensee >
- Remshart >
- Jahresgrafik

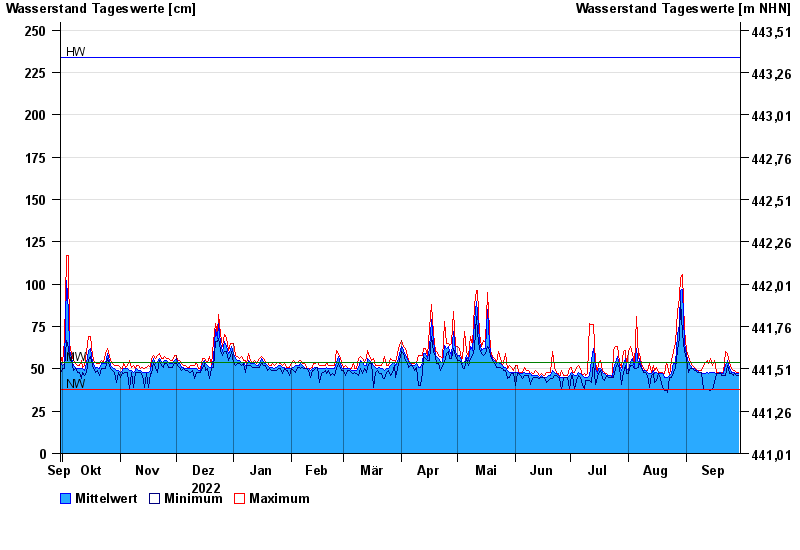
Jahresgrafik Remshart / Kammel
Wasserstand vom 30.09.2022 bis zum 29.09.2023
| Datum | Mittelwert [cm] | Maximum [cm] | Minimum [cm] |
|---|---|---|---|
| 29.09.2023 | 47 | 48 | 46 |
| 28.09.2023 | 47 | 48 | 46 |
| 27.09.2023 | 48 | 49 | 47 |
| 26.09.2023 | 48 | 49 | 46 |
| 25.09.2023 | 48 | 50 | 47 |
| 24.09.2023 | 50 | 54 | 47 |
| 23.09.2023 | 55 | 59 | 52 |
© Bayerisches Landesamt für Umwelt 2024