
- Startseite >
- Flüsse >
- Wasserstand >
- Iller - Lech - Bodensee >
- Remshart >
- Jahresgrafik

Jahresgrafik Remshart / Kammel
Wasserstand vom 05.12.2020 bis zum 04.12.2021
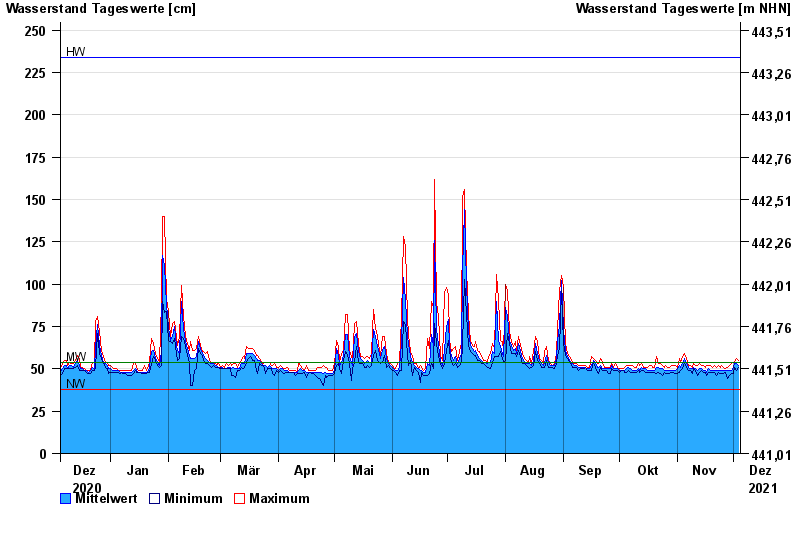
| Datum | Mittelwert [cm] | Maximum [cm] | Minimum [cm] |
|---|---|---|---|
| 04.12.2021 | 52 | 55 | 51 |
| 03.12.2021 | 53 | 56 | 49 |
| 02.12.2021 | 53 | 54 | 51 |
| 01.12.2021 | 51 | 54 | 47 |
| 30.11.2021 | 49 | 53 | 47 |
| 29.11.2021 | 49 | 52 | 46 |
| 28.11.2021 | 49 | 51 | 44 |
© Bayerisches Landesamt für Umwelt 2024