
- Startseite >
- Flüsse >
- Wasserstand >
- Iller - Lech - Bodensee >
- Remshart >
- Jahresgrafik

Jahresgrafik Remshart / Kammel
Wasserstand vom 06.08.2022 bis zum 05.08.2023
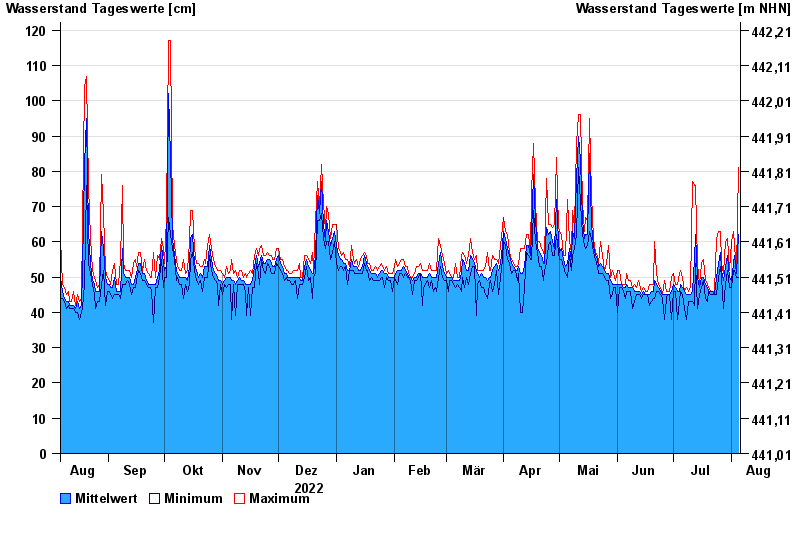
| Datum | Mittelwert [cm] | Maximum [cm] | Minimum [cm] |
|---|---|---|---|
| 05.08.2023 | 62 | 81 | 50 |
| 04.08.2023 | 51 | 52 | 50 |
| 03.08.2023 | 56 | 59 | 52 |
| 02.08.2023 | 54 | 63 | 52 |
| 01.08.2023 | 49 | 60 | 47 |
| 31.07.2023 | 50 | 52 | 47 |
| 30.07.2023 | 56 | 61 | 52 |
© Bayerisches Landesamt für Umwelt 2024