
- Startseite >
- Flüsse >
- Wasserstand >
- Iller - Lech - Bodensee >
- Remshart >
- Jahresgrafik

Jahresgrafik Remshart / Kammel
Wasserstand vom 30.07.2022 bis zum 29.07.2023
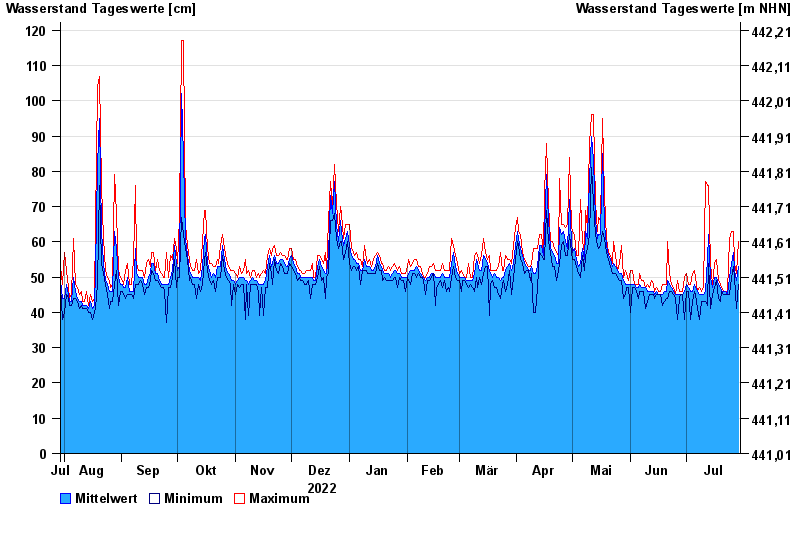
- Hochwassergefahrenfläche HQ100 240 cm
| Datum | Mittelwert [cm] | Maximum [cm] | Minimum [cm] |
|---|---|---|---|
| 29.07.2023 | 53 | 60 | 48 |
| 28.07.2023 | 49 | 51 | 41 |
| 27.07.2023 | 52 | 54 | 50 |
| 26.07.2023 | 57 | 63 | 53 |
| 25.07.2023 | 54 | 63 | 50 |
| 24.07.2023 | 50 | 61 | 45 |
| 23.07.2023 | 45 | 46 | 45 |
© Bayerisches Landesamt für Umwelt 2024