
- Startseite >
- Flüsse >
- Wasserstand >
- Iller - Lech - Bodensee >
- Oberaudorf >
- Jahresgrafik

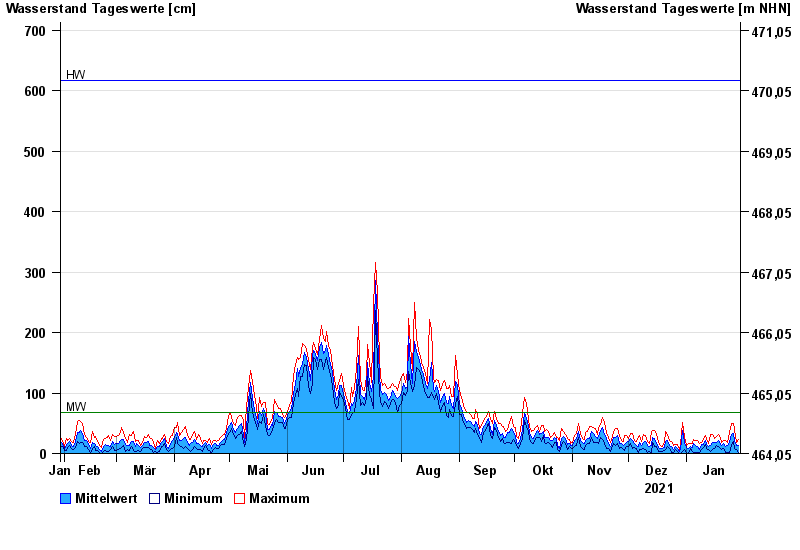
Jahresgrafik Oberaudorf / Inn
Wasserstand vom 30.01.2021 bis zum 29.01.2022
| Datum | Mittelwert [cm] | Maximum [cm] | Minimum [cm] |
|---|---|---|---|
| 29.01.2022 | 13 | 23 | -- |
| 28.01.2022 | 14 | 18 | 7 |
| 27.01.2022 | 21 | 39 | 9 |
| 26.01.2022 | 33 | 49 | 20 |
| 25.01.2022 | 32 | 49 | 14 |
| 24.01.2022 | 18 | 35 | 1 |
| 23.01.2022 | 13 | 18 | 2 |
© Bayerisches Landesamt für Umwelt 2024