
- Startseite >
- Flüsse >
- Wasserstand >
- Iller - Lech - Bodensee >
- Oberaudorf >
- Jahresgrafik

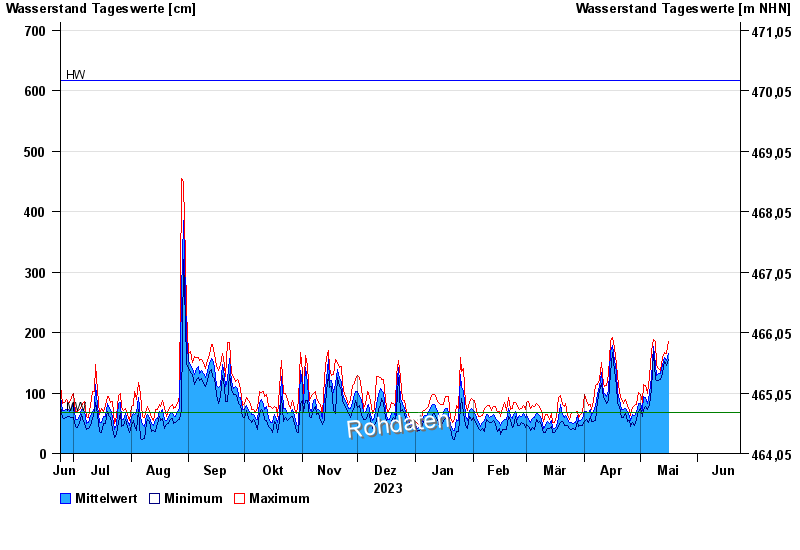
Jahresgrafik Oberaudorf / Inn
Wasserstand vom 24.06.2023 bis zum 23.06.2024
| Datum | Mittelwert [cm] | Maximum [cm] | Minimum [cm] |
|---|---|---|---|
| 05.06.2024 | 159 | 166 | 153 |
| 04.06.2024 | 191 | 273 | 146 |
| 03.06.2024 | 200 | 277 | 120 |
| 02.06.2024 | 121 | 154 | 103 |
| 01.06.2024 | 187 | 219 | 156 |
| 31.05.2024 | 189 | 207 | 168 |
| 30.05.2024 | 149 | 170 | 136 |
© Bayerisches Landesamt für Umwelt 2024