
- Startseite >
- Flüsse >
- Wasserstand >
- Iller - Lech - Bodensee >
- Leuterschach >
- Jahresgrafik

Jahresgrafik Leuterschach / Lobach
Wasserstand vom 25.10.2021 bis zum 24.10.2022
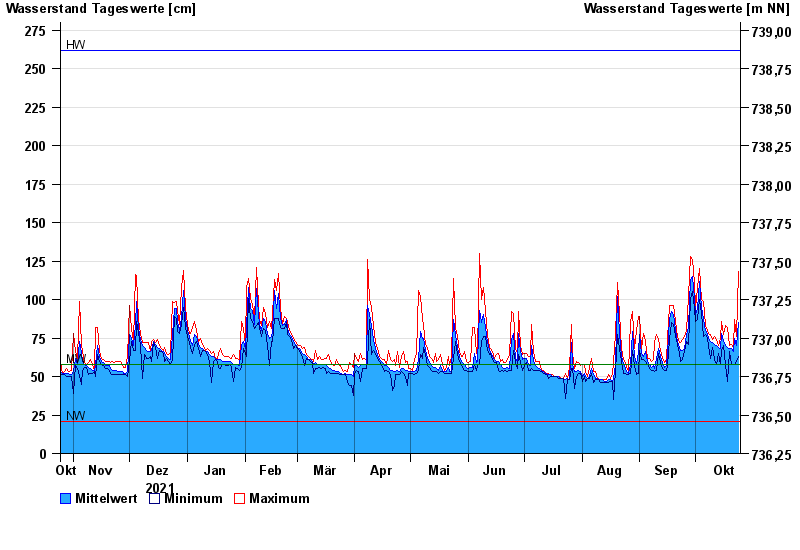
| Datum | Mittelwert [cm] | Maximum [cm] | Minimum [cm] |
|---|---|---|---|
| 24.10.2022 | 85 | 118 | 63 |
| 23.10.2022 | 70 | 76 | 60 |
| 22.10.2022 | 75 | 87 | 58 |
| 21.10.2022 | 66 | 69 | 58 |
| 20.10.2022 | 68 | 71 | 58 |
| 19.10.2022 | 68 | 70 | 66 |
| 18.10.2022 | 69 | 82 | 47 |
© Bayerisches Landesamt für Umwelt 2024