
- Startseite >
- Flüsse >
- Wasserstand >
- Iller - Lech - Bodensee >
- Leuterschach >
- Jahresgrafik

Jahresgrafik Leuterschach / Lobach
Wasserstand vom 17.10.2019 bis zum 16.10.2020
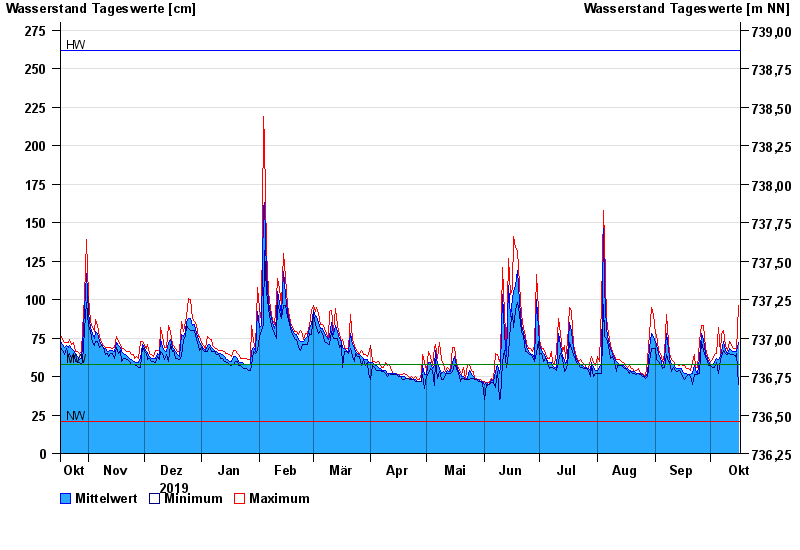
| Datum | Mittelwert [cm] | Maximum [cm] | Minimum [cm] |
|---|---|---|---|
| 16.10.2020 | 72 | 96 | 45 |
| 15.10.2020 | 66 | 67 | 65 |
| 14.10.2020 | 66 | 68 | 63 |
| 13.10.2020 | 66 | 68 | 64 |
| 12.10.2020 | 67 | 70 | 64 |
| 11.10.2020 | 68 | 73 | 65 |
| 10.10.2020 | 65 | 67 | 64 |
© Bayerisches Landesamt für Umwelt 2024