
- Startseite >
- Flüsse >
- Wasserstand >
- Iller - Lech - Bodensee >
- Leuterschach >
- Jahresgrafik

Jahresgrafik Leuterschach / Lobach
Wasserstand vom 09.07.2019 bis zum 08.07.2020
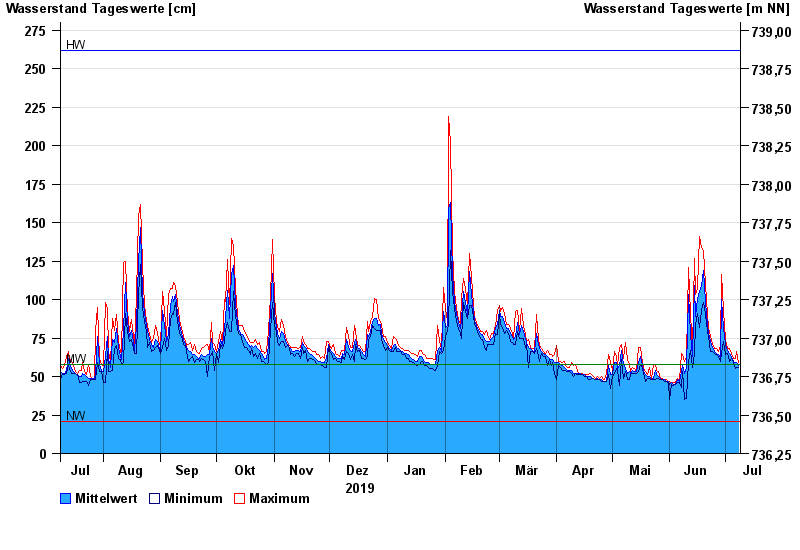
| Datum | Mittelwert [cm] | Maximum [cm] | Minimum [cm] |
|---|---|---|---|
| 08.07.2020 | 57 | 59 | 56 |
| 07.07.2020 | 59 | 66 | 56 |
| 06.07.2020 | 59 | 62 | 55 |
| 05.07.2020 | 60 | 62 | 59 |
| 04.07.2020 | 63 | 65 | 62 |
| 03.07.2020 | 65 | 68 | 60 |
| 02.07.2020 | 67 | 68 | 65 |
© Bayerisches Landesamt für Umwelt 2024