
- Startseite >
- Flüsse >
- Wasserstand >
- Iller - Lech - Bodensee >
- Lechbruck >
- Jahresgrafik

Jahresgrafik Lechbruck / Lech
Wasserstand vom 29.03.2024 bis zum 28.03.2025
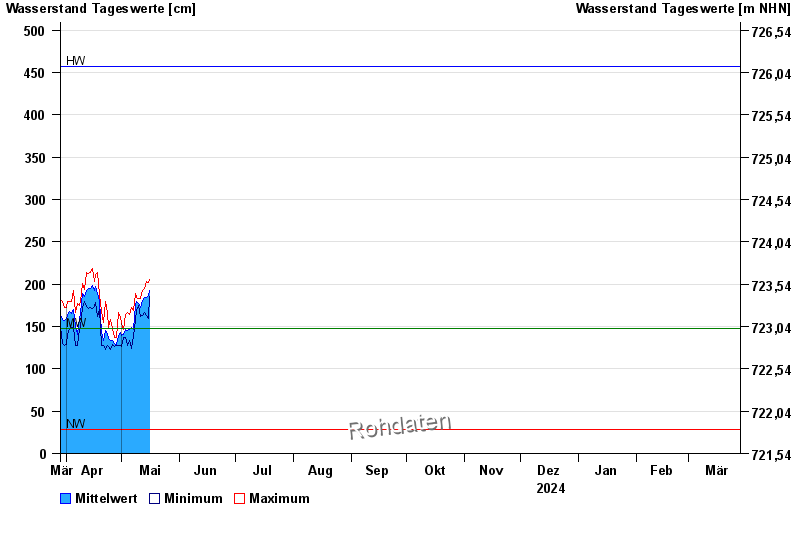
Hinweis
Messwerte beeinflusst durch Kraftwerkssteuerungen.
| Datum | Mittelwert [cm] | Maximum [cm] | Minimum [cm] |
|---|---|---|---|
| 29.04.2024 | 134 | 153 | 127 |
| 28.04.2024 | 129 | 137 | 127 |
| 27.04.2024 | 130 | 137 | 126 |
| 26.04.2024 | 133 | 148 | 129 |
| 25.04.2024 | 133 | 158 | 123 |
| 24.04.2024 | 136 | 149 | 126 |
| 23.04.2024 | 141 | 165 | 128 |
© Bayerisches Landesamt für Umwelt 2024