
- Startseite >
- Flüsse >
- Wasserstand >
- Iller - Lech - Bodensee >
- Lauben >
- Jahresgrafik

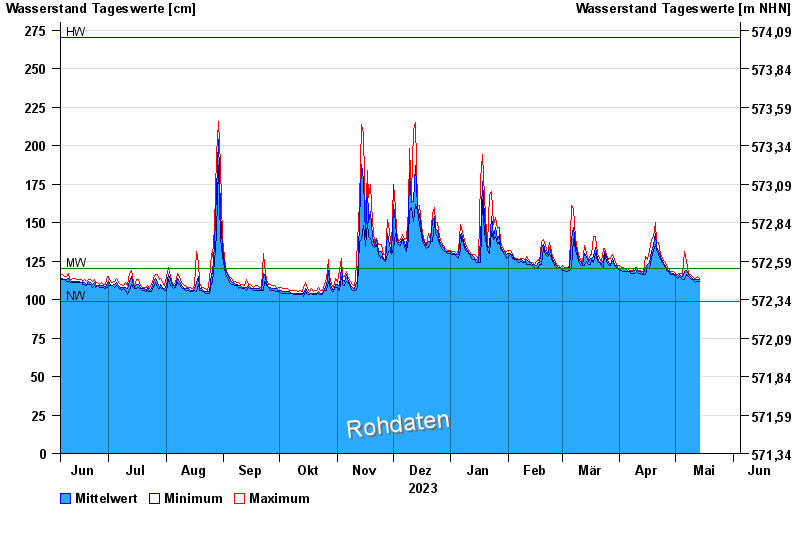
Jahresgrafik Lauben / Günz
Wasserstand vom 05.06.2023 bis zum 04.06.2024
| Datum | Mittelwert [cm] | Maximum [cm] | Minimum [cm] |
|---|---|---|---|
| 28.04.2024 | 118 | 119 | 117 |
| 27.04.2024 | 119 | 120 | 118 |
| 26.04.2024 | 121 | 122 | 119 |
| 25.04.2024 | 123 | 125 | 122 |
| 24.04.2024 | 125 | 127 | 124 |
| 23.04.2024 | 128 | 130 | 126 |
| 22.04.2024 | 132 | 137 | 129 |
© Bayerisches Landesamt für Umwelt 2024