
- Startseite >
- Flüsse >
- Wasserstand >
- Iller - Lech - Bodensee >
- Lauben >
- Jahresgrafik

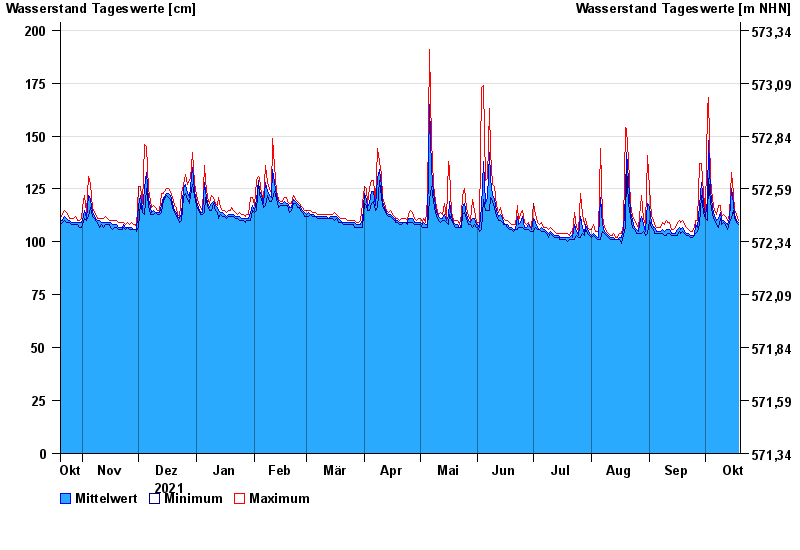
Jahresgrafik Lauben / Günz
Wasserstand vom 20.10.2021 bis zum 19.10.2022
| Datum | Mittelwert [cm] | Maximum [cm] | Minimum [cm] |
|---|---|---|---|
| 19.10.2022 | 109 | 110 | 108 |
| 18.10.2022 | 110 | 113 | 109 |
| 17.10.2022 | 113 | 115 | 111 |
| 16.10.2022 | 118 | 123 | 115 |
| 15.10.2022 | 125 | 133 | 111 |
| 14.10.2022 | 111 | 113 | 109 |
| 13.10.2022 | 108 | 110 | 106 |
© Bayerisches Landesamt für Umwelt 2024