
- Startseite >
- Flüsse >
- Wasserstand >
- Iller - Lech - Bodensee >
- Landsberg >
- Jahresgrafik

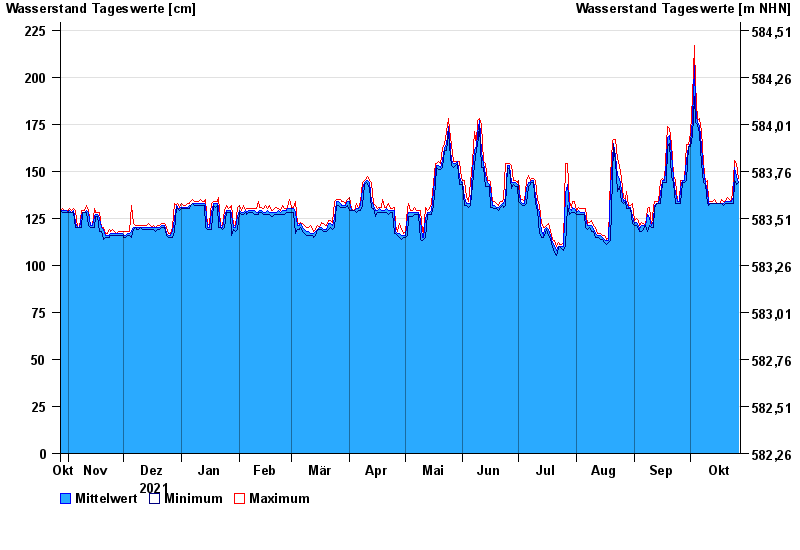
Jahresgrafik Landsberg / Lech
Wasserstand vom 28.10.2021 bis zum 27.10.2022
Hinweis
Messwerte beeinflusst durch Kraftwerkssteuerungen.
- 10.08.1970 Wasserstand: 478 cm
- 22.05.1999 Wasserstand: 437 cm
- 23.08.2005 Wasserstand: 414 cm
- 24.07.1966 Wasserstand: 408 cm
- 11.06.1965 Wasserstand: 390 cm
| Datum | Mittelwert [cm] | Maximum [cm] | Minimum [cm] |
|---|---|---|---|
| 27.10.2022 | 144 | 146 | 144 |
| 26.10.2022 | 147 | 154 | 143 |
| 25.10.2022 | 152 | 156 | 145 |
| 24.10.2022 | 136 | 145 | 133 |
| 23.10.2022 | 134 | 134 | 133 |
| 22.10.2022 | 134 | 135 | 133 |
| 21.10.2022 | 134 | 136 | 133 |
© Bayerisches Landesamt für Umwelt 2024