
- Startseite >
- Flüsse >
- Wasserstand >
- Iller - Lech - Bodensee >
- Landsberg >
- Jahresgrafik

Jahresgrafik Landsberg / Lech
Wasserstand vom 02.12.2023 bis zum 01.12.2024
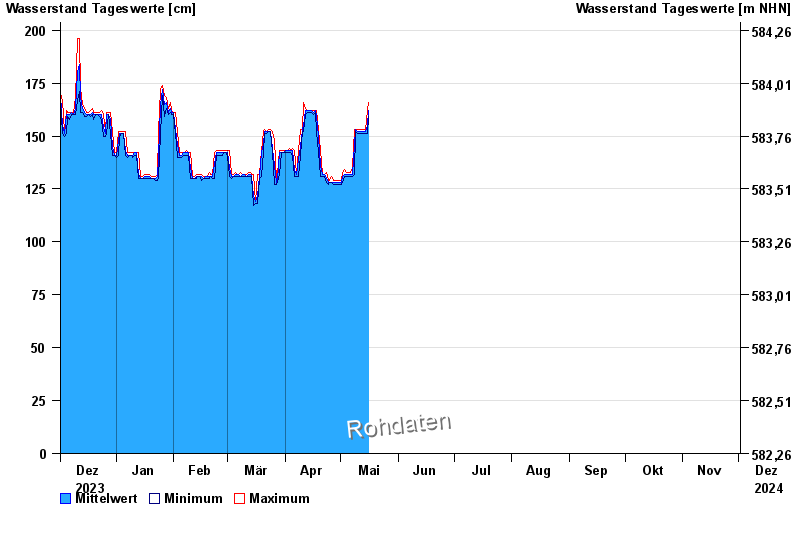
Hinweis
Messwerte beeinflusst durch Kraftwerkssteuerungen.
- 10.08.1970 Wasserstand: 478 cm
- 22.05.1999 Wasserstand: 437 cm
- 23.08.2005 Wasserstand: 414 cm
- 24.07.1966 Wasserstand: 408 cm
- 11.06.1965 Wasserstand: 390 cm
| Datum | Mittelwert [cm] | Maximum [cm] | Minimum [cm] |
|---|---|---|---|
| 21.06.2024 | 173 | 180 | 171 |
| 20.06.2024 | 172 | 173 | 171 |
| 19.06.2024 | 177 | 185 | 171 |
| 18.06.2024 | 162 | 171 | 161 |
| 17.06.2024 | 162 | 162 | 161 |
| 16.06.2024 | 162 | 164 | 160 |
| 15.06.2024 | 163 | 165 | 161 |
© Bayerisches Landesamt für Umwelt 2024