
- Startseite >
- Flüsse >
- Wasserstand >
- Iller - Lech - Bodensee >
- Gschwend >
- Jahresgrafik

Jahresgrafik Gschwend / Rottach
Wasserstand vom 08.07.2020 bis zum 07.07.2021
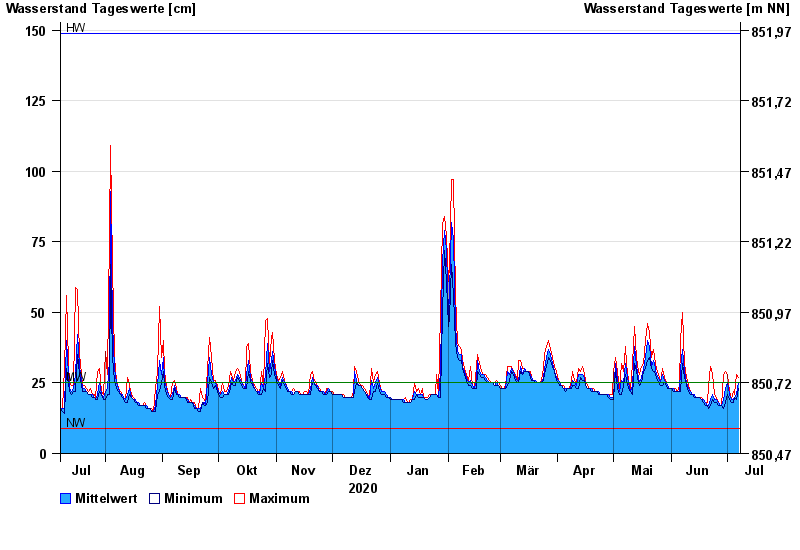
| Datum | Mittelwert [cm] | Maximum [cm] | Minimum [cm] |
|---|---|---|---|
| 07.07.2021 | 25 | 27 | 23 |
| 06.07.2021 | 21 | 28 | 19 |
| 05.07.2021 | 20 | 21 | 20 |
| 04.07.2021 | 19 | 22 | 18 |
| 03.07.2021 | 19 | 19 | 18 |
| 02.07.2021 | 21 | 22 | 19 |
| 01.07.2021 | 25 | 28 | 21 |
© Bayerisches Landesamt für Umwelt 2024