
- Startseite >
- Flüsse >
- Wasserstand >
- Iller - Lech - Bodensee >
- Gschwend >
- Jahresgrafik

Jahresgrafik Gschwend / Rottach
Wasserstand vom 01.01.2024 bis zum 27.04.2024
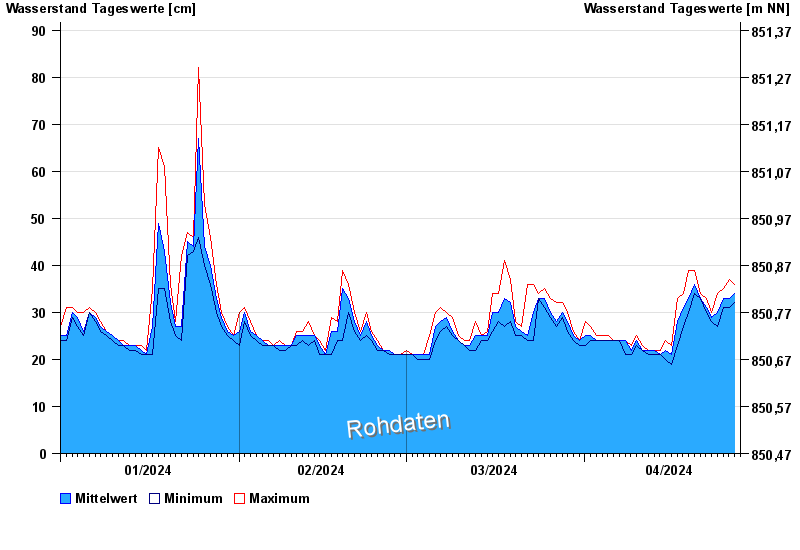
| Datum | Mittelwert [cm] | Maximum [cm] | Minimum [cm] |
|---|---|---|---|
| 27.04.2024 | 35 | 35 | 34 |
| 26.04.2024 | 33 | 37 | 31 |
| 25.04.2024 | 33 | 35 | 31 |
| 24.04.2024 | 30 | 34 | 27 |
| 23.04.2024 | 29 | 30 | 28 |
| 22.04.2024 | 31 | 33 | 30 |
| 21.04.2024 | 33 | 34 | 33 |
© Bayerisches Landesamt für Umwelt 2024