
- Startseite >
- Flüsse >
- Wasserstand >
- Iller - Lech - Bodensee >
- Gruben >
- Jahresgrafik

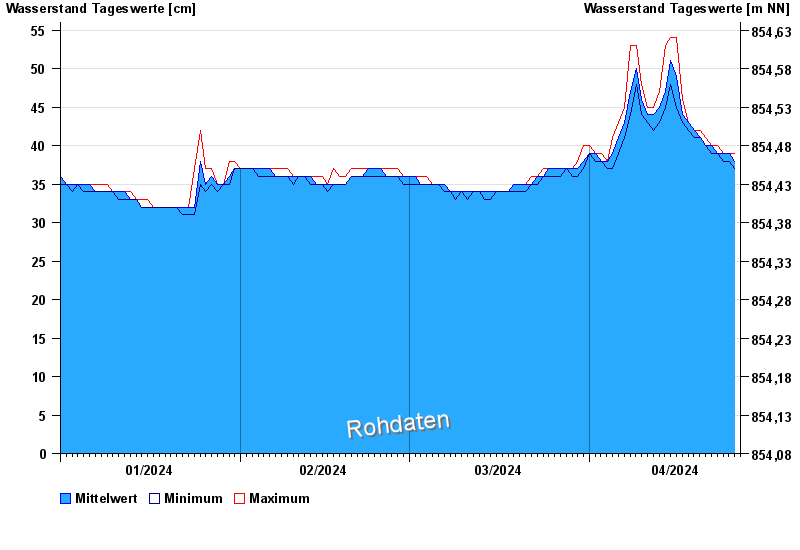
Jahresgrafik Gruben / Oybach
Wasserstand vom 01.01.2024 bis zum 26.04.2024
Abflusswerte unsicher
Beeinflussung durch Baumaßnahme
- 06.08.2010 Wasserstand: 89 cm
- 10.10.2011 Wasserstand: 88 cm
- 01.06.2013 Wasserstand: 87 cm
- 21.05.2019 Wasserstand: 85 cm
- 03.06.2010 Wasserstand: 83 cm
| Datum | Mittelwert [cm] | Maximum [cm] | Minimum [cm] |
|---|---|---|---|
| 26.04.2024 | 38 | 39 | 38 |
| 25.04.2024 | 39 | 39 | 38 |
| 24.04.2024 | 39 | 39 | 38 |
| 23.04.2024 | 39 | 40 | 39 |
| 22.04.2024 | 40 | 40 | 39 |
| 21.04.2024 | 40 | 41 | 40 |
| 20.04.2024 | 41 | 42 | 41 |
© Bayerisches Landesamt für Umwelt 2024