
- Startseite >
- Flüsse >
- Wasserstand >
- Iller - Lech - Bodensee >
- Görisried >
- Jahresgrafik

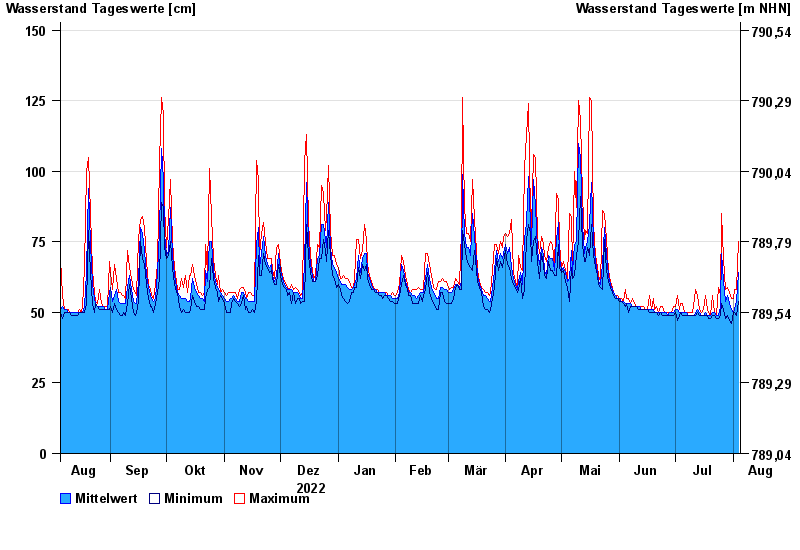
Jahresgrafik Görisried / Waldbach
Wasserstand vom 05.08.2022 bis zum 04.08.2023
| Datum | Mittelwert [cm] | Maximum [cm] | Minimum [cm] |
|---|---|---|---|
| 04.08.2023 | 64 | 75 | 54 |
| 03.08.2023 | 54 | 58 | 49 |
| 02.08.2023 | 51 | 58 | 50 |
| 01.08.2023 | 50 | 55 | 50 |
| 31.07.2023 | 51 | 55 | 46 |
| 30.07.2023 | 53 | 57 | 47 |
| 29.07.2023 | 56 | 59 | 49 |
© Bayerisches Landesamt für Umwelt 2024