
- Startseite >
- Flüsse >
- Wasserstand >
- Iller - Lech - Bodensee >
- Görisried >
- Jahresgrafik

Jahresgrafik Görisried / Waldbach
Wasserstand vom 05.07.2023 bis zum 04.07.2024
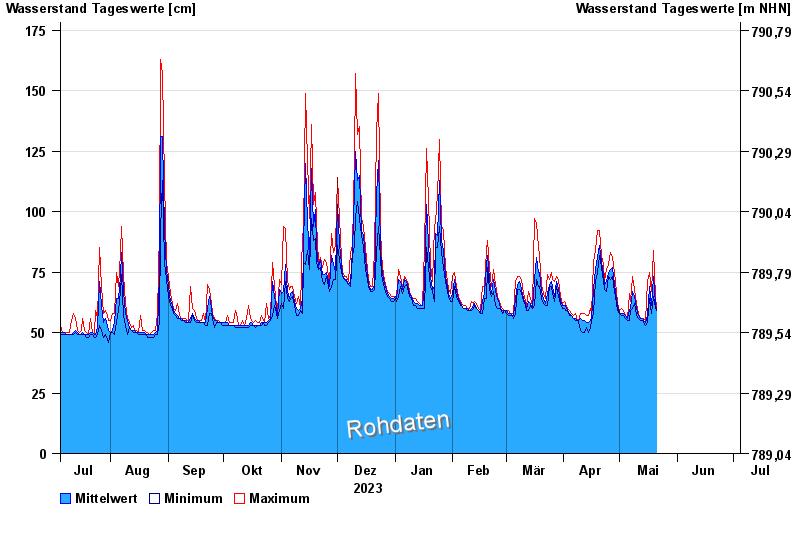
| Datum | Mittelwert [cm] | Maximum [cm] | Minimum [cm] |
|---|---|---|---|
| 21.05.2024 | 60 | 64 | 59 |
| 20.05.2024 | 62 | 65 | 60 |
| 19.05.2024 | 73 | 84 | 65 |
| 18.05.2024 | 61 | 67 | 58 |
| 17.05.2024 | 69 | 75 | 64 |
| 16.05.2024 | 57 | 71 | 54 |
| 15.05.2024 | 54 | 55 | 53 |
© Bayerisches Landesamt für Umwelt 2024