
- Startseite >
- Flüsse >
- Wasserstand >
- Iller - Lech - Bodensee >
- Görisried >
- Jahresgrafik

Jahresgrafik Görisried / Waldbach
Wasserstand vom 17.04.2024 bis zum 16.04.2025
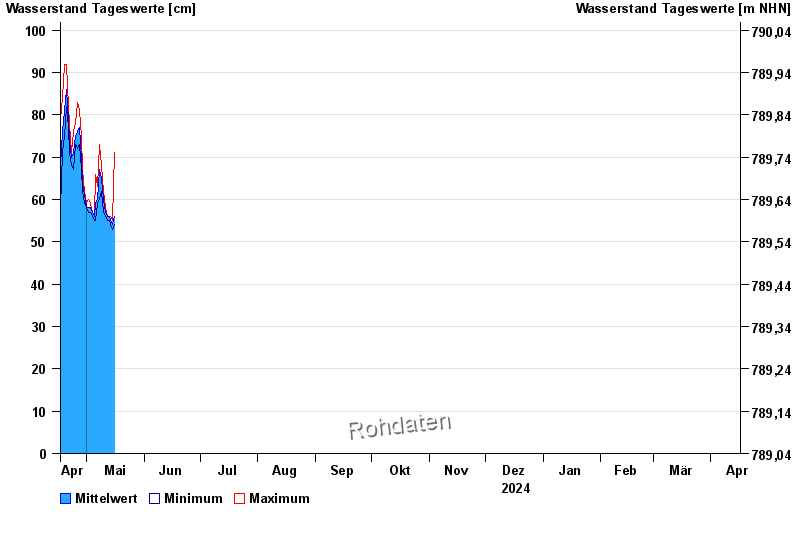
| Datum | Mittelwert [cm] | Maximum [cm] | Minimum [cm] |
|---|---|---|---|
| 29.04.2024 | 65 | 67 | 62 |
| 28.04.2024 | 70 | 75 | 67 |
| 27.04.2024 | 77 | 81 | 73 |
| 26.04.2024 | 76 | 83 | 72 |
| 25.04.2024 | 75 | 78 | 73 |
| 24.04.2024 | 71 | 76 | 67 |
| 23.04.2024 | 70 | 71 | 68 |
© Bayerisches Landesamt für Umwelt 2024