
- Startseite >
- Flüsse >
- Wasserstand >
- Iller - Lech - Bodensee >
- Eschach >
- Jahresgrafik

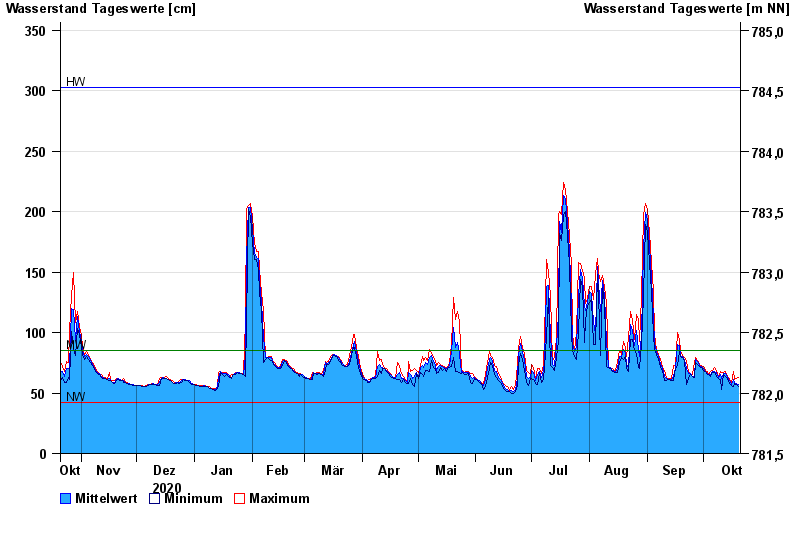
Jahresgrafik Eschach / Füssener Achen
Wasserstand vom 21.10.2020 bis zum 20.10.2021
| Datum | Mittelwert [cm] | Maximum [cm] | Minimum [cm] |
|---|---|---|---|
| 20.10.2021 | 57 | 63 | 55 |
| 19.10.2021 | 58 | 62 | 57 |
| 18.10.2021 | 59 | 61 | 58 |
| 17.10.2021 | 61 | 68 | 55 |
| 16.10.2021 | 57 | 58 | 56 |
| 15.10.2021 | 60 | 62 | 58 |
| 14.10.2021 | 63 | 64 | 62 |
© Bayerisches Landesamt für Umwelt 2024